

Reading this result: you get your money back part-way through year 3. On a discounted basis the money never fully comes back within the period entered, which tells you this project does not clear a 10% hurdle.
General information only, not financial advice. Check any figure before you act on it.
Free payback period calculator Excel workbook
The same method as the calculator above, in a spreadsheet you can keep, edit and share — with simple and discounted payback side by side, a recovery chart and a project comparison.
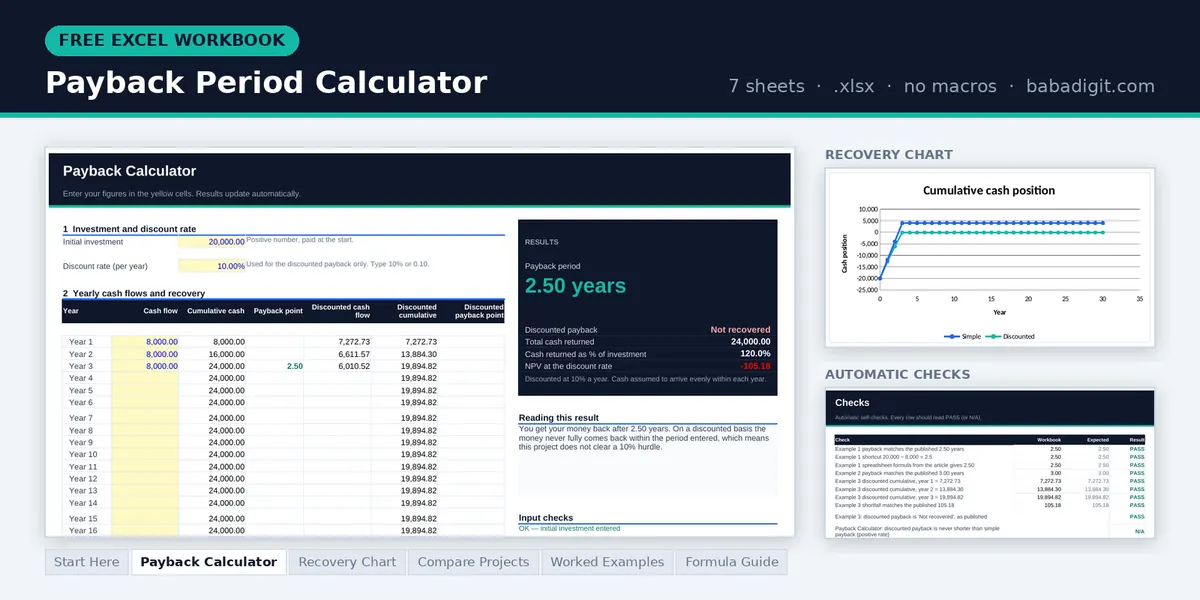
- Payback Calculator — up to 30 years of cash flows; simple payback, discounted payback, NPV for context
- Recovery Chart — cumulative cash position, simple and discounted, year by year
- Compare Projects — four projects ranked by how fast they pay back
- Worked examples, formula guide and checks — including why discounted payback is always longer
Opens in Microsoft Excel or LibreOffice Calc. General information only, not financial advice.
Payback shows how fast money comes back, not how much a project is worth. The Financial Model Template is a paid spreadsheet that builds a linked five-year P&L, balance sheet and cash flow from one assumptions sheet. To check payback next to NPV and IRR for the same project, the Investment Appraisal Template puts them side by side. Browse all templates
What the payback period actually measures
The payback period answers the simplest question anyone asks about an investment: how long until I have my money back? It counts cash coming in until the running total reaches what you originally put out, and reports the point where that happens.
It is the least sophisticated of the appraisal measures and by far the most used, because it maps onto how people actually think about risk. A business owner deciding whether to buy a machine is not usually running discounted cash flow models in their head — they are asking whether the thing will have paid for itself before something goes wrong.
That instinct is sound. Payback is a crude proxy for risk and for liquidity: the sooner your capital is back in hand, the less exposed you are to a forecast being wrong. Where it fails is as a measure of value, because it stops counting the moment you break even and never asks what happens afterwards.
The payback formula
Payback = Full years before recovery + (Amount still outstanding ÷ Cash flow in the next year)Discounted payback uses the same method on present-valued cash flowsWhen cash flows are even, this simplifies to investment divided by annual cash flow. When they are uneven you have to run the cumulative total year by year, which is what the calculator above does. The fractional part assumes cash arrives evenly through the year — if yours is seasonal, treat the decimal as an approximation.
Three worked examples
Even cash flows
A simple machine
A $20,000 machine generates $8,000 a year.
End of year 2: 16,000 recovered, 4,000 outstanding
Year 3: 4,000 ÷ 8,000 = 0.50 of a year
Payback = 2.50 years
Straightforward, and for even flows you can shortcut it: 20,000 ÷ 8,000 = 2.5. Note what the figure does not tell you — whether the machine lasts four years or fifteen. Those extra years are where all the profit is, and payback ignores them entirely.
Uneven cash flows
A business that builds up
A $60,000 project returns $15,000, then $20,000, then $25,000, then $30,000.
End of year 2: 35,000 cumulative
End of year 3: 60,000 cumulative — exactly recovered
Payback = 3.00 years
With uneven flows there is no shortcut; you have to walk the cumulative total. Here it lands exactly on a year end, which is unusual — normally you take the fraction of the next year’s cash needed to close the gap.
Discounted payback
The same machine, with time value
Take the $20,000 machine returning $8,000 a year, and discount each year’s cash at 10% before counting it.
Year 2: 8,000 ÷ 1.10² = 6,611.57 (cumulative 13,884.30)
Year 3: 8,000 ÷ 1.10³ = 6,010.52 (cumulative 19,894.82)
Still 105.18 short — never recovered within three years
Simple payback said 2.5 years and looked fine. Discounted payback says the money never fully comes back at all. That $105.18 gap is exactly the negative NPV this project shows on the NPV calculator — the same fact, told two ways.
Where payback misleads you
How to use payback sensibly
Treat it as a risk filter, not a decision rule. Its real job is to answer “how long am I exposed?” alongside NPV answering “is this worth doing?”. Two projects with identical NPVs but paybacks of two and seven years are not equally attractive, and payback is the measure that shows the difference.
Use the discounted version whenever the project runs more than two or three years, and always pair the result with NPV before committing. If the discounted payback never completes within the project’s life, the NPV is negative — those two statements are mathematically identical.
Payback, NPV and IRR compared
| Measure | Answers | Counts cash after break-even? | Best used as |
|---|---|---|---|
| Payback | How long am I exposed? | No | A risk filter |
| NPV | How much value is created? | Yes | The decision rule |
| IRR | What rate does it earn? | Yes | Communicating the result |
How to calculate payback in Excel or Google Sheets
There is no built-in payback function. Build a cumulative column and read off where it turns positive. With the outlay in B1 as a negative and cash flows in B2 downwards:
C2: =B1+B2 then C3: =C2+B3, copied down=COUNTIF(C2:C10,"<0") + ABS(INDEX(C2:C10,COUNTIF(C2:C10,"<0"))) / INDEX(B2:B10,COUNTIF(C2:C10,"<0")+1)The second formula counts the full years still in deficit, then adds the fraction of the following year needed to close the remaining gap. For discounted payback, build the cumulative column on discounted flows instead — =B2/(1+rate)^n — and use the same approach.
Frequently asked questions
What is a good payback period?
It depends entirely on the asset and the industry. Software and marketing investments are often expected back within a year; manufacturing equipment within three to five; property and infrastructure over much longer. The honest benchmark is the asset’s useful life — paying back in four years is excellent for something that lasts twenty and alarming for something that lasts five.
Simple or discounted payback?
Discounted, for anything running beyond two or three years, because it accounts for the fact that later cash is worth less. Simple payback is fine as a quick check on short projects. Quote which one you used — the two can differ substantially, as the third example above shows.
What if the investment is never paid back?
Then the project loses money over the period you modelled, and its NPV at that discount rate is negative. The calculator reports this rather than showing a misleading figure. It does not necessarily mean reject — it may simply mean your forecast period is shorter than the asset’s life.
Should I include depreciation in the cash flows?
No. Payback works on cash, and depreciation is an accounting entry that moves no money. Use cash generated — typically profit after tax with depreciation added back. Including it would understate your cash flows and overstate the payback period.
Can payback be used to choose between projects?
Only as a tie-breaker. Ranking purely on payback systematically favours short, small projects over ones that create more value. Rank on NPV, then use payback to check whether the winner leaves you exposed for uncomfortably long.
How do I handle a salvage or resale value?
Add it to the cash flow for the year you expect to sell. Be aware that this can make payback land in the final year purely because of the sale, which is a different and weaker result than recovering your money from operations.
References
- Brealey, R. A., Myers, S. C. & Allen, F. Principles of Corporate Finance, 13th edition, McGraw-Hill Education — on payback as an appraisal method and its limitations.
- Damodaran, A. Investment Valuation: Tools and Techniques for Determining the Value of Any Asset, 3rd edition, Wiley — on capital budgeting criteria.
Keep going
Written and reviewed by Ghayas Uddin, MS (Finance), financial analyst. Last reviewed 21 September 2026. Found an error? Email support@babadigit.com and we will correct it.