

Reading this result: every dollar of owners’ money produced 18.00 cents of profit this year. Judge it against what that money could earn elsewhere, and check how much of it was borrowed.
General information only, not financial advice. Check any figure before you act on it.
Free ROE calculator Excel workbook
The same method as the calculator above, in a spreadsheet you can keep, edit and share — with a profit and equity sensitivity grid, a three-part DuPont breakdown and a four-company comparison.
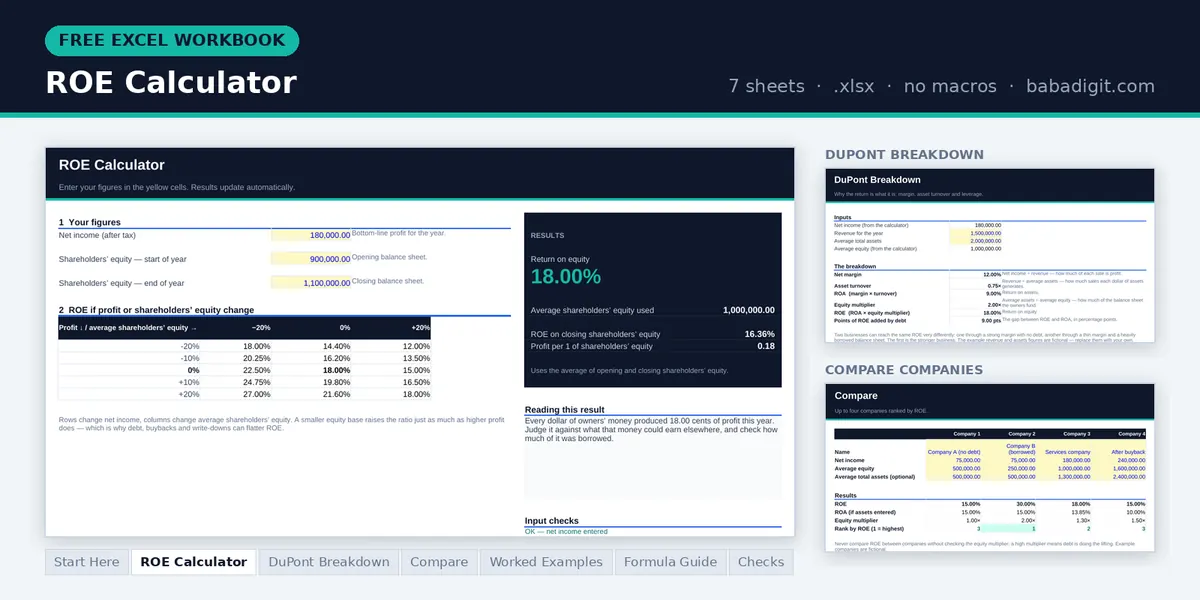
- ROE Calculator — ROE on average and closing equity, profit per 1 of equity and a sensitivity grid
- DuPont Breakdown — net margin × asset turnover × equity multiplier
- Compare — up to four companies ranked by ROE, with ROA and how much debt sits behind each
- Worked examples, formula guide and checks — including the leverage and buyback traps
Opens in Microsoft Excel or LibreOffice Calc. General information only, not financial advice.
Read ROE alongside the rest of the accounts. The Financial Ratio Analysis Template is a paid spreadsheet that calculates twenty-one liquidity, profitability, efficiency and leverage ratios from one sheet of figures, each with a plain-English note. Browse all templates
What return on equity actually measures
Return on equity answers one question: for every dollar the owners have tied up in this business, how much profit did the business make this year? It is the closest thing accounting has to a scorecard for the owners specifically, rather than for the business as a whole.
The denominator is what makes it different from every other return measure. Shareholders’ equity is what is left after every liability is subtracted from every asset — the part of the company the owners actually own. Money the company borrowed is not in there. So ROE deliberately ignores the lenders and reports only on the owners’ slice.
That focus is also its trap. A company can raise its ROE without becoming any better at its business, simply by replacing equity with debt. Half the skill in reading ROE is knowing when a high number reflects a good business and when it reflects a heavily borrowed one.
The ROE formula
ROE (%) = Net income ÷ Shareholders’ equity × 100Average equity = (Opening equity + Closing equity) ÷ 2Net income is a figure earned across the whole year; equity is a snapshot on one day. Mixing the two is slightly unfair, which is why analysts normally divide by average equity rather than the closing balance. The calculator above does this for you, and shows the closing-equity version underneath so you can see how much difference the choice makes. If a company raised capital or bought back shares mid-year, the difference can be large.
Three worked examples
Ordinary case
A services company
A consultancy earns $180,000 after tax. Equity opened the year at $900,000 and closed at $1,100,000, the increase being retained profit.
ROE = 180,000 ÷ 1,000,000 × 100 = 18.00%
On closing equity alone: 180,000 ÷ 1,100,000 = 16.36%
Eighteen percent is a healthy return for a business with little debt. Note that simply using the closing figure would have understated it by more than a percentage point, because the company grew its equity during the year it was earning that profit.
The leverage trap
Two identical businesses, different funding
Company A and Company B run the same operation and both earn $75,000 after tax. A is funded entirely by its owners with $500,000 of equity. B’s owners put in $250,000 and borrowed the rest.
Company B: 75,000 ÷ 250,000 × 100 = 30.00%
B’s ROE is double A’s, and B is not one cent better at running the business. Borrowing shrank the denominator, and that is all. It also doubled the owners’ exposure: if profits turn to losses, B’s equity is wiped out twice as fast. Never compare ROE between two companies without checking how much debt sits behind each one.
Accounting effects
A share buyback
A company earns a steady $240,000 a year. It spends cash buying back its own shares, taking equity from $2,000,000 down to $1,200,000 over the year. Operations are unchanged.
Average equity this year = (2,000,000 + 1,200,000) ÷ 2 = 1,600,000
ROE this year = 240,000 ÷ 1,600,000 × 100 = 15.00%
On closing equity = 240,000 ÷ 1,200,000 × 100 = 20.00%
The same profit now looks like a return somewhere between 15% and 20%, depending which denominator you pick, and the business did nothing differently. Buybacks, write-downs and large dividends all shrink equity and flatter ROE for exactly this reason.
Where ROE misleads you
The DuPont breakdown
DuPont analysis splits ROE into three drivers, which tells you why a return is what it is rather than just what it is:
ROE = Net margin × Asset turnover × Equity multiplierEquity multiplier = Total assets ÷ Shareholders’ equityA company with a 10% net margin, asset turnover of 1.2 and an equity multiplier of 2.0 has an ROE of 24%. Read that as: decent profitability, reasonable asset efficiency, and half the balance sheet funded by debt. A competitor reaching the same 24% through a 20% margin, 1.2 turnover and a multiplier of 1.0 is the far stronger business, because it got there without borrowing. Same headline number, entirely different quality.
ROE, ROA and ROI compared
| Measure | Whose money | Denominator | Affected by debt? |
|---|---|---|---|
| ROE | The owners’ | Shareholders’ equity | Yes — strongly |
| ROA | Everyone’s | Total assets | Barely |
| ROI | Whoever funded the project | Money put into one decision | Only if you include it |
Read ROE next to ROA, always. When the two are close, the business is funded mostly by its owners. When ROE is far above ROA, debt is doing the lifting — and the gap between them is roughly the size of that effect.
How to calculate ROE in Excel or Google Sheets
Net income in B1, opening equity in B2, closing equity in B3:
=B1/AVERAGE(B2:B3)=B1/B3 ← closing-equity versionFormat as Percentage rather than multiplying by 100, so the cell keeps its true value for any later calculation.
Frequently asked questions
What is a good ROE?
It depends entirely on the industry and on how much debt sits behind the number. Software and consultancy businesses hold few assets and routinely post high ROEs; utilities and manufacturers hold enormous asset bases and post much lower ones. Compare a company only against its own history and its direct competitors, and always alongside ROA.
Should I use average or closing equity?
Average, whenever you have both figures. Net income is earned across the whole year while equity is a single-day snapshot, so averaging the opening and closing balances is the fairer comparison. Use closing equity only when the opening figure is unavailable, and say which you used.
Why is a high ROE sometimes a bad sign?
Because debt and buybacks both shrink equity, which is the denominator. A company can lift its ROE substantially without improving operations at all, while quietly increasing the risk that a bad year wipes out the owners. Check the debt level and the equity trend before treating a high ROE as good news.
Can ROE be negative?
Yes, when the company makes a loss. A negative ROE on positive equity simply means the owners’ capital shrank that year. But when equity itself is negative, the arithmetic produces a nonsense figure — a loss divided by negative equity returns a positive percentage. In that situation ROE should not be quoted at all.
ROE or ROA — which should I use?
Use ROE to judge the return to owners, and ROA to judge how well the business uses everything it controls regardless of who funded it. They answer different questions, and the gap between them tells you how leveraged the company is. Neither one replaces the other.
Does ROE work for a small private business?
Yes, and it is often more meaningful than for a listed company, because the owner’s equity is real money they could have put elsewhere. One adjustment matters: if the owner pays themselves below a market salary, net income is overstated and so is ROE. Charge a proper wage first, then calculate.
References
- Brealey, R. A., Myers, S. C. & Allen, F. Principles of Corporate Finance, 13th edition, McGraw-Hill Education — on financial ratios and the effect of leverage on returns.
- Damodaran, A. Investment Valuation: Tools and Techniques for Determining the Value of Any Asset, 3rd edition, Wiley — on return measures and accounting distortions.
Keep going
Written and reviewed by Ghayas Uddin, MS (Finance), financial analyst. Last reviewed 21 September 2026. Found an error? Email support@babadigit.com and we will correct it.