

Reading this result: short-term assets exceed short-term obligations by 180,000.00. Excluding inventory, there is still 1.10 of liquid assets for every 1.00 owed within the year.
General information only, not financial advice. Check any figure before you act on it.
Free working capital calculator Excel workbook
The same method as the calculator above, in a spreadsheet you can keep, edit and share — with the cash growth will tie up and a twelve-month liquidity trend, charted.
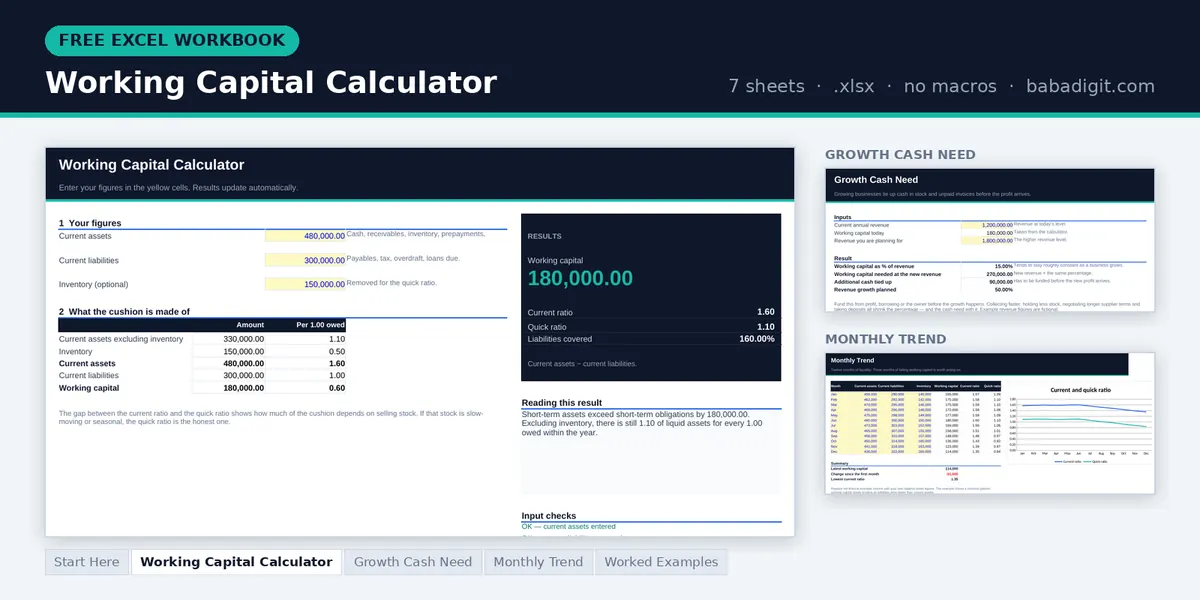
- Working Capital Calculator — working capital, current and quick ratios, and what the cushion is made of
- Growth Cash Need — the extra cash a higher revenue level will tie up
- Monthly Trend — twelve months of working capital and both ratios, with a chart
- Worked examples, formula guide and checks — including why growing businesses run out of cash
Opens in Microsoft Excel or LibreOffice Calc. General information only, not financial advice.
Want to know how many days your cash is tied up? The Working Capital Management Template is a paid spreadsheet that tracks DSO, DIO, DPO and the cash conversion cycle month by month, and values the cash that shorter cycles would release. Browse all templates
What working capital actually measures
Working capital (often called net working capital) is current assets minus current liabilities — what the business owns that will turn into cash within a year, less what it owes within the same year. It is the cushion between the money coming in and the bills falling due. The change in working capital is this period’s figure minus the previous period’s: an increase ties up cash, a decrease releases it.
Profit and working capital are different things, and businesses fail on the second while reporting the first. A company can be profitable on paper while every dollar of that profit sits in unsold stock and unpaid invoices. Working capital is the measure that catches this, because it looks at whether obligations can actually be met, not whether sales exceeded costs.
The current ratio expresses the same idea as a multiple rather than an amount, which makes it comparable between businesses of different sizes. The quick ratio goes further by removing inventory, on the grounds that stock is the current asset least likely to become cash quickly when you need it.
The working capital formulas
Working capital = Current assets − Current liabilitiesCurrent ratio = Current assets ÷ Current liabilitiesQuick ratio = (Current assets − Inventory) ÷ Current liabilitiesCurrent assets are those expected to become cash within twelve months: cash itself, money owed by customers, inventory, and prepayments. Current liabilities are what falls due in the same window: supplier invoices, tax, accruals, overdrafts, and the portion of any loan repayable this year. That last item is easy to miss and often material.
Three worked examples
Healthy position
A trading business
Current assets of $480,000, of which $150,000 is inventory. Current liabilities of $300,000.
Current ratio = 480,000 ÷ 300,000 = 1.60
Quick ratio = 330,000 ÷ 300,000 = 1.10
Comfortable. The gap between 1.60 and 1.10 shows how much of the cushion depends on selling stock. If that inventory is slow-moving or seasonal, the quick ratio is the honest one.
Under pressure
Negative working capital
Current assets fall to $220,000 while current liabilities stay at $300,000.
Current ratio = 220,000 ÷ 300,000 = 0.73
For most businesses this is a warning: obligations due within the year exceed the resources available to meet them. But it is not automatically fatal — supermarkets and subscription businesses often run negative working capital by design, because customers pay immediately while suppliers are paid in sixty days. The question is whether it reflects a funding model or a funding problem.
The growth trap
Why growing businesses run out of cash
The healthy business above turns over $1,200,000 and carries $180,000 of working capital — 15% of revenue. It wins new customers and revenue rises to $1,800,000.
1,800,000 × 15% = 270,000
Additional cash tied up = 90,000
Fifty percent growth has quietly consumed $90,000, which has to be funded from profit, borrowing or the owner’s pocket before any of the new profit arrives. This is the single most common reason profitable businesses fail, and the calculation above is how you see it coming.
Where working capital ratios mislead you
How to improve working capital
| Lever | What to do | Speed of effect |
|---|---|---|
| Collect faster | Invoice on completion, chase earlier, offer card payment | Fast |
| Hold less stock | Order smaller and more often, clear slow lines | Medium |
| Pay suppliers later | Negotiate terms openly rather than paying late | Medium |
| Take deposits | Charge up front on large or bespoke orders | Fast |
These four levers make up the cash conversion cycle: how many days pass between paying for stock and being paid by the customer. Shortening that cycle releases cash without any need to borrow or sell more.
How to calculate working capital in Excel or Google Sheets
Current assets in B1, current liabilities in B2, inventory in B3:
=B1-B2 ← working capital=B1/B2 ← current ratio=(B1-B3)/B2 ← quick ratioPut these on a monthly row and chart the trend. Twelve points reveal far more than any single month, particularly for a seasonal business.
Frequently asked questions
What is a good current ratio?
Between roughly 1.5 and 2.0 suits most trading businesses. Below 1.0 means short-term obligations exceed short-term assets; well above 3.0 often means capital is sitting idle. Industry matters more than any rule of thumb — fast-turnover retail operates safely at levels that would alarm a manufacturer.
Is negative working capital always bad?
No. Businesses whose customers pay immediately while suppliers wait sixty days — supermarkets, restaurants, subscription services — run negative working capital as a normal and highly efficient state. It is a problem when it results from slow collection or mounting unpaid bills rather than from the business model.
Why does growth consume working capital?
Because you buy stock and pay staff before customers pay you. Every extra sale widens that gap. Working capital tends to stay a roughly constant percentage of revenue, so growing revenue by half requires roughly half as much again tied up — funded before the profit from those sales arrives.
Current ratio or quick ratio?
Both. The current ratio shows the full cushion; the quick ratio shows what remains if stock cannot be sold quickly. The gap between them tells you how dependent your liquidity is on inventory. For a stock-heavy business, the quick ratio is the more honest number.
Does working capital include the bank overdraft?
Yes. An overdraft is repayable on demand, so it is a current liability. The same applies to the portion of any term loan due within twelve months. Leaving these out is a common error that makes the position look considerably better than it is.
How often should I check it?
Monthly for most businesses, weekly if cash is tight or you are growing fast. The trend matters more than the level: three consecutive months of falling working capital is a signal worth acting on long before any single figure looks alarming.
References
- Brealey, R. A., Myers, S. C. & Allen, F. Principles of Corporate Finance, 13th edition, McGraw-Hill Education — on working capital management and short-term financial planning.
- Horngren, C. T., Datar, S. M. & Rajan, M. V. Cost Accounting: A Managerial Emphasis, 16th edition, Pearson — on liquidity measures.
Keep going
Written and reviewed by Ghayas Uddin, MS (Finance), financial analyst. Last reviewed 21 September 2026. Found an error? Email support@babadigit.com and we will correct it.