
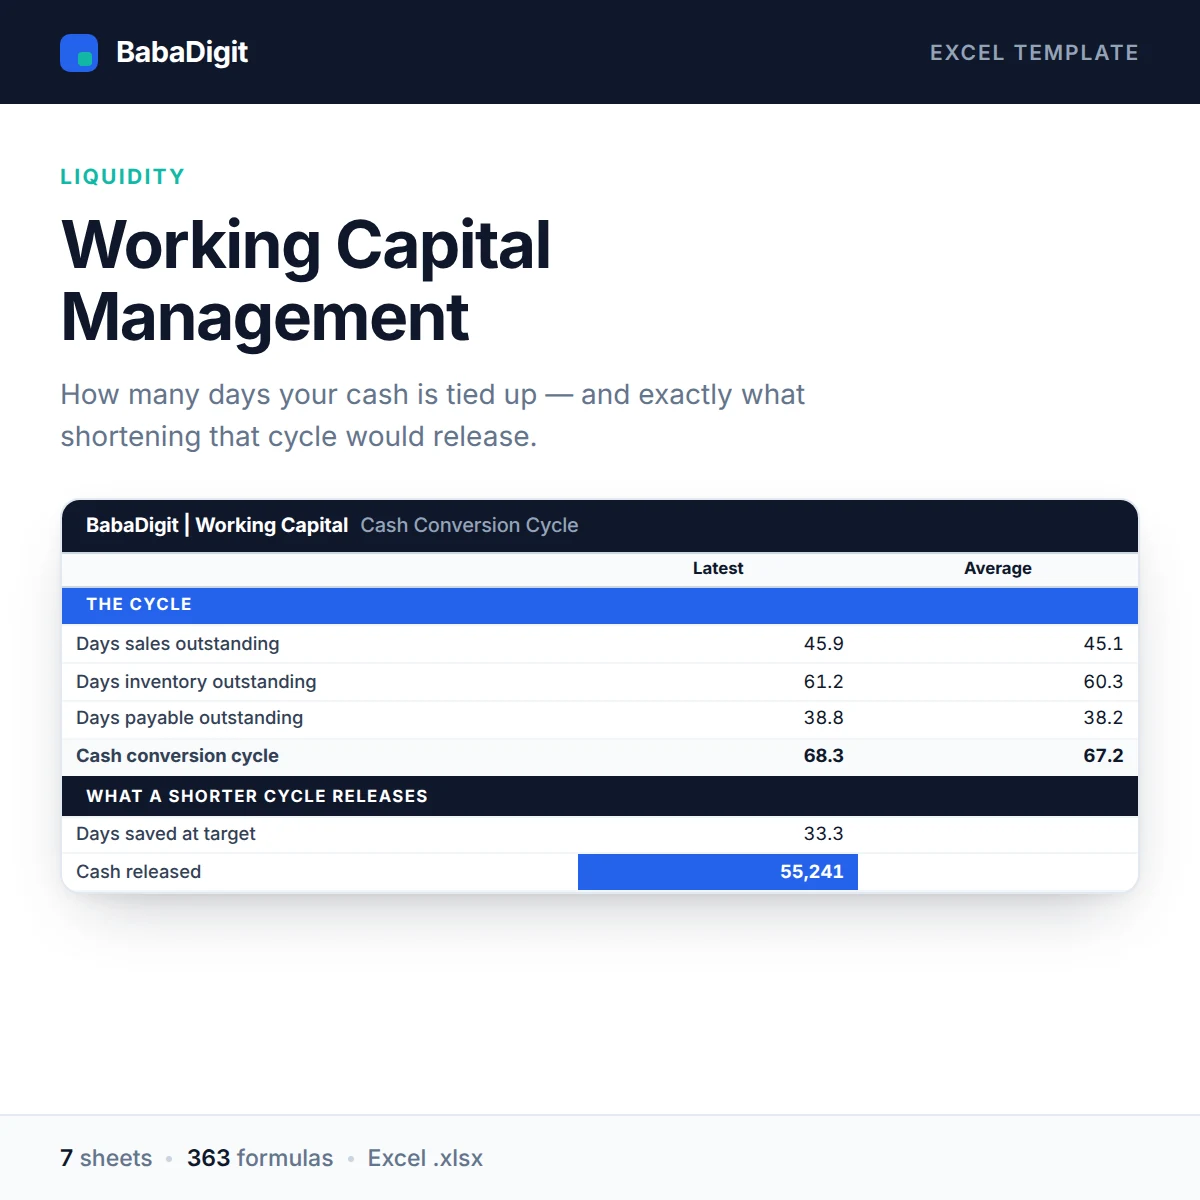

Most businesses that run short of cash are not unprofitable. Their money is sitting in stock nobody has bought and invoices nobody has paid, while suppliers want paying now. The cash conversion cycle measures exactly that, in days.
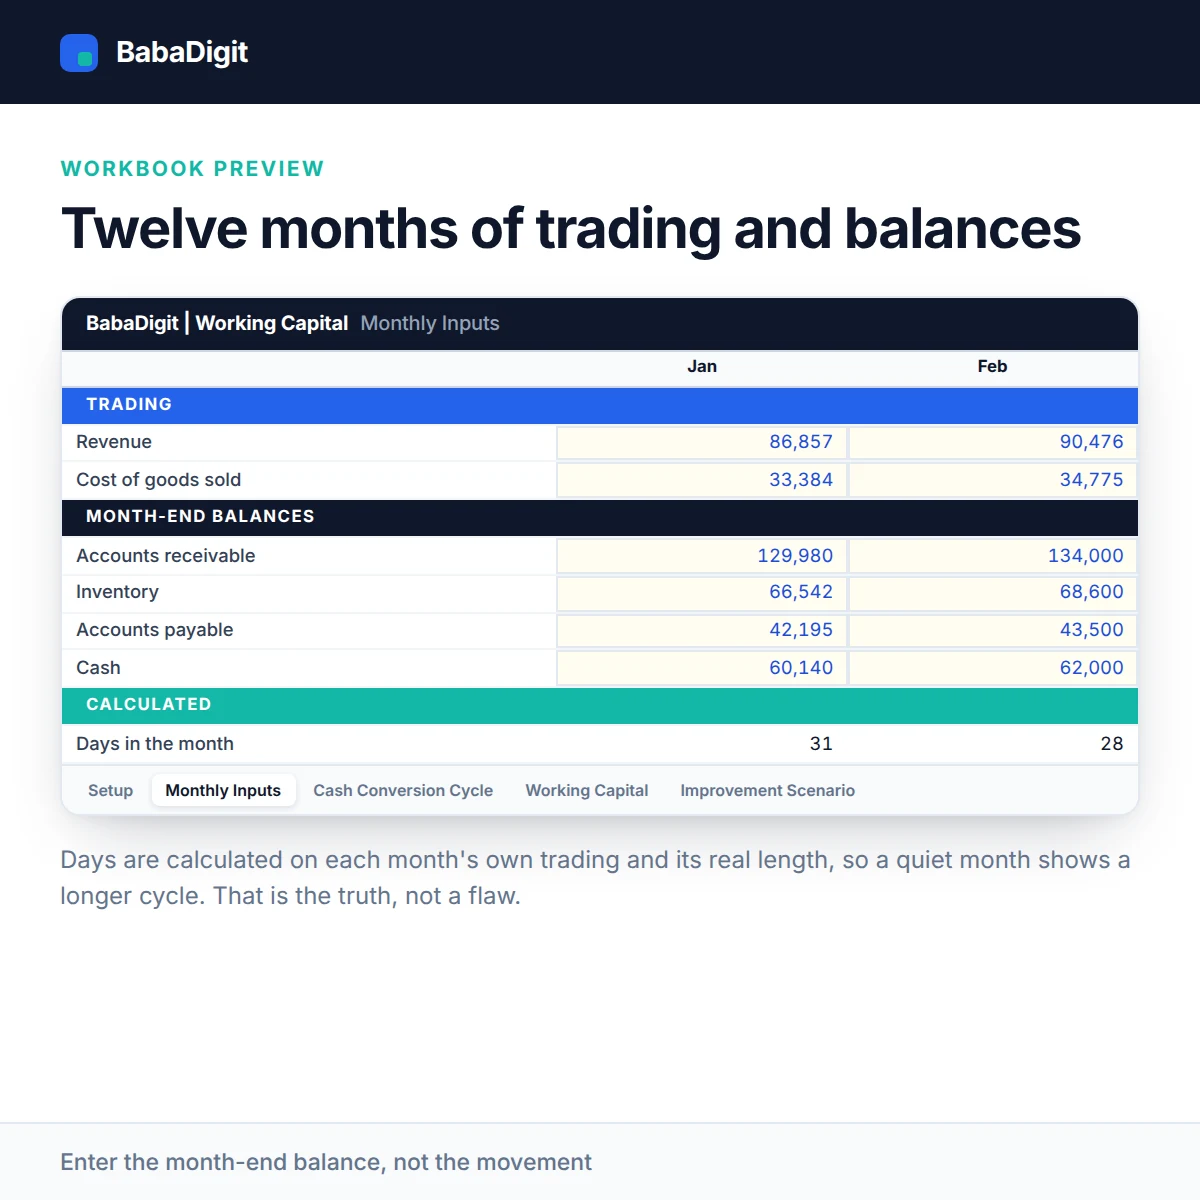
This template calculates DSO, DIO and DPO for each of twelve months from your own revenue, cost of sales and month-end balances, and combines them into the cycle. Because it uses each month’s own trading and the real number of days in that month, a quiet month shows a longer cycle which is the truth, not a flaw.
The Working Capital sheet shows what the cycle costs you: current assets against current liabilities, working capital with and without cash, and the current and quick ratios.
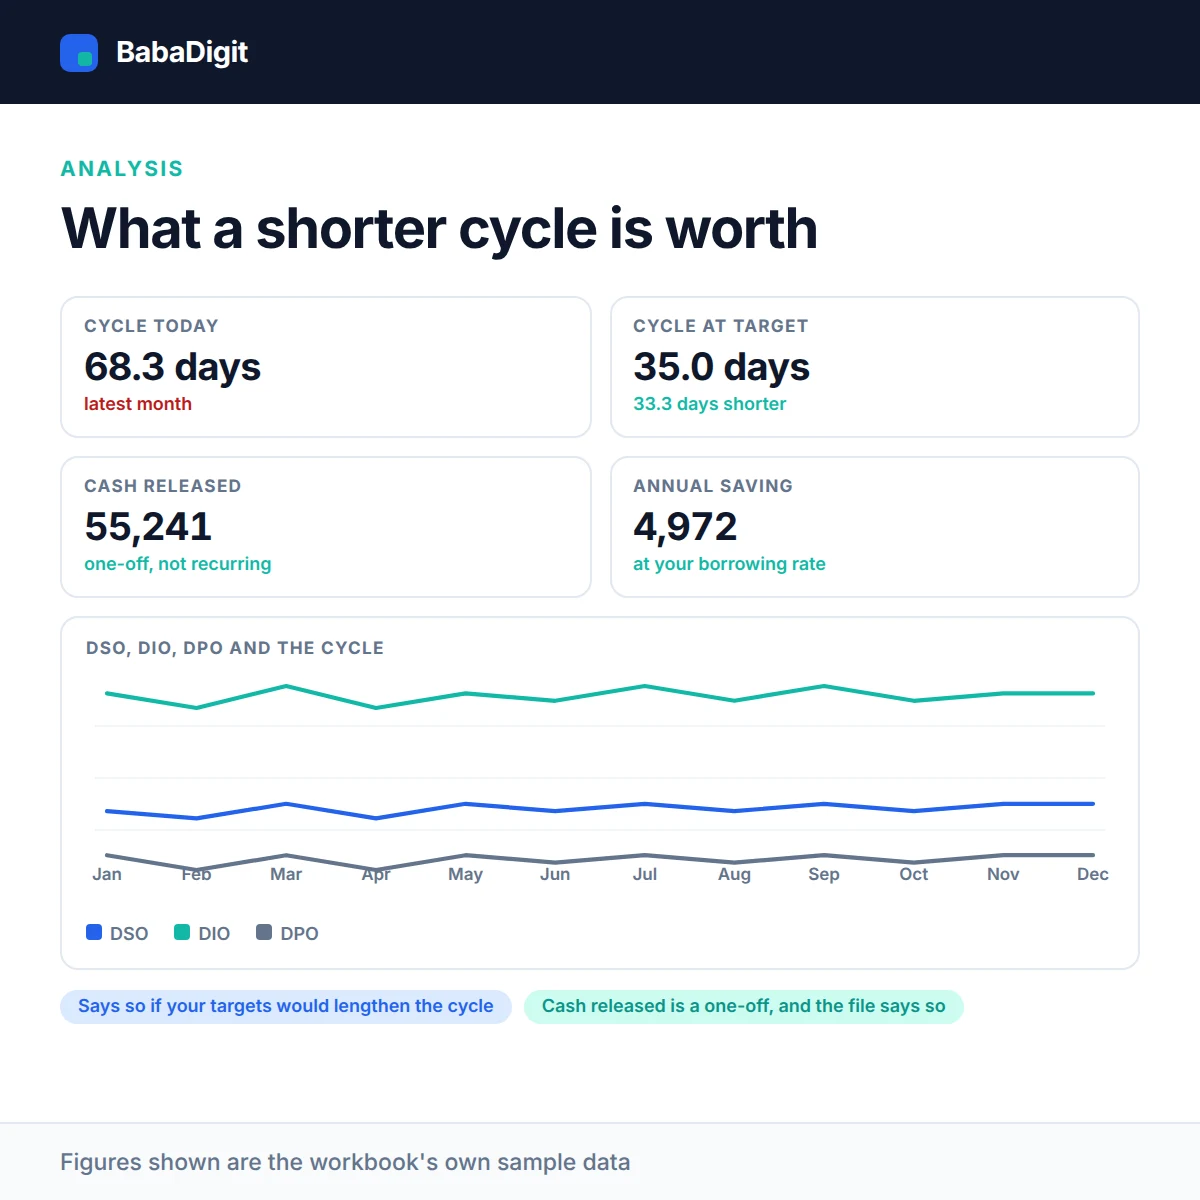
Then the Improvement Scenario does the part that matters. You set the days you think you could realistically achieve, and the sheet values the difference how much cash each day released is worth, what the total comes to, and what it saves annually at your own borrowing rate. If your targets would actually lengthen the cycle, it says so rather than reporting a saving that is not there.
Understanding the cash conversion cycle
The cash conversion cycle (CCC) shows how long cash remains tied up in day-to-day operations before it returns through customer collections. It is calculated as:
Cash Conversion Cycle = DSO + DIO − DPO
- Days Sales Outstanding (DSO): The average time taken to collect payment from customers. A higher DSO generally means cash remains tied up in receivables for longer.
- Days Inventory Outstanding (DIO): The average time inventory is held before it is sold or used. Higher inventory days can indicate that more cash is committed to stock.
- Days Payable Outstanding (DPO): The average time taken to pay suppliers. A longer payment period can help preserve cash, provided supplier agreements and relationships are maintained.
A shorter cash conversion cycle generally means cash returns to the business more quickly. However, the individual measures should be considered together. For example, extending supplier payment periods may reduce the cycle but could create problems if it goes beyond agreed payment terms.
The monthly analysis helps identify whether changes in collections, inventory levels or supplier payments are affecting the time cash remains tied up in operations.
What you get
- Twelve-month DSO, DIO, DPO and cash conversion cycle
- Days calculated on each month’s real length
- Current assets, current liabilities, working capital with and without cash
- Current ratio and quick ratio
- Improvement scenario valuing days released in cash
- Annual borrowing saving on the cash released
- Four-line cycle chart
- Configurable currency — no currency is hard-coded
- No country’s tax rates or statutory rules built in
- Sheets protected without a password
- No macros, no add-ins, no internet connection required
Who it is for
Finance managers, business owners and credit controllers who need to free cash from the balance sheet rather than raise it.
In the download
- Excel workbook, fully formula-driven
- README with the full usage guide
- Licence covering commercial and client use
- Worked sample data throughout, clearly labelled
Sheets in the workbook
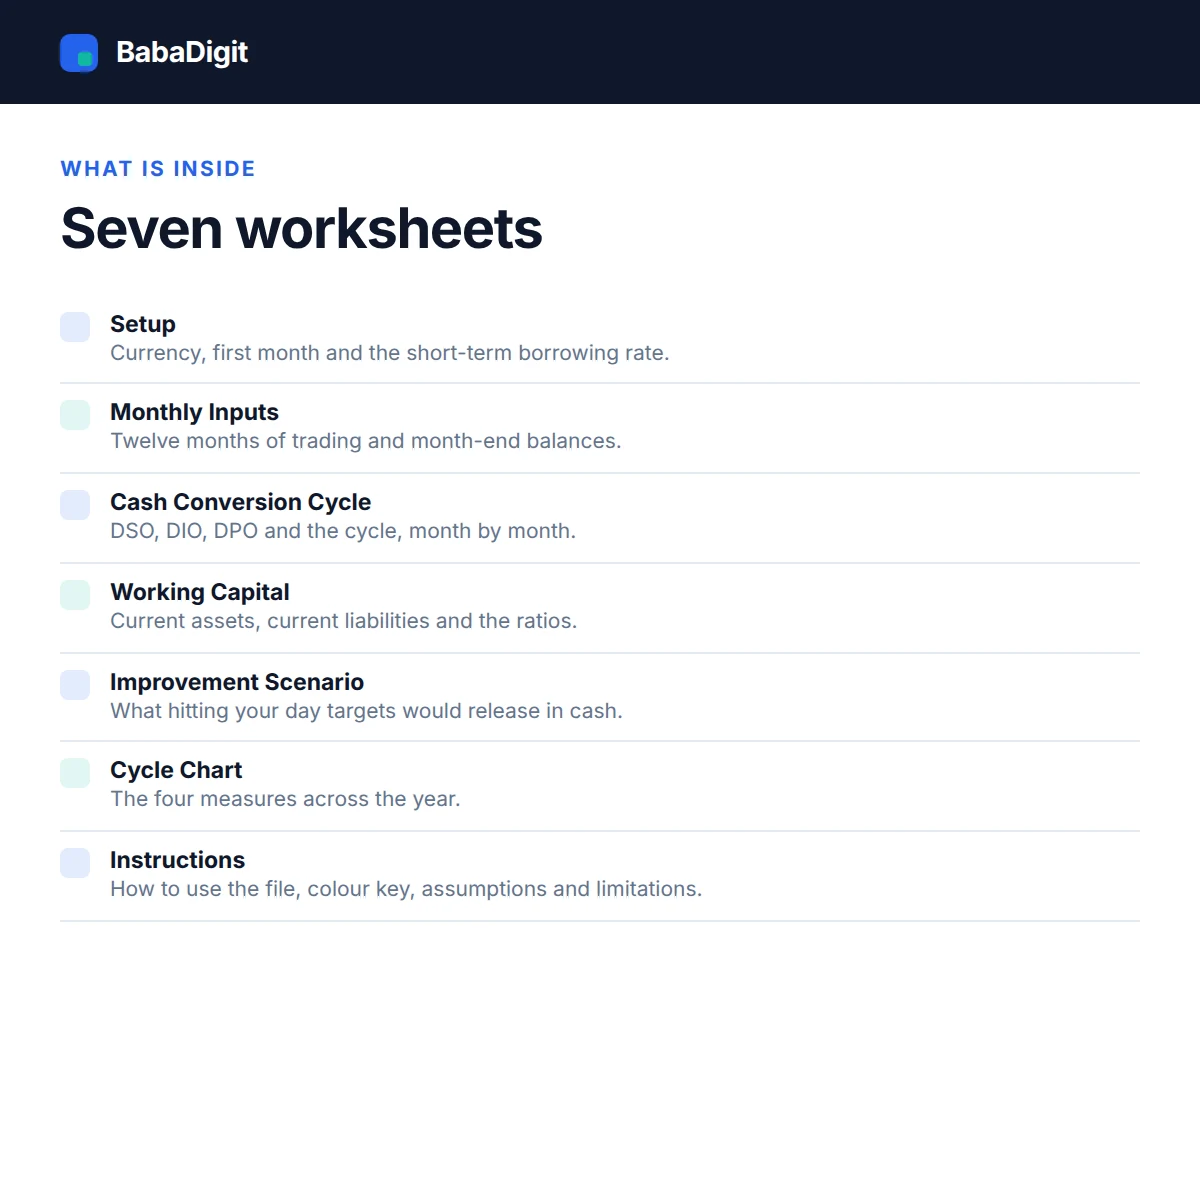
- Instructions: How to use the file, colour key, assumptions and limitations.
- Setup: Currency, first month and the short-term borrowing rate.
- Monthly Inputs: Twelve months of trading and month-end balances.
- Cash Conversion Cycle: DSO, DIO, DPO and the cycle, month by month.
- Working Capital: Current assets, current liabilities and the ratios.
- Improvement Scenario: What hitting your day targets would release in cash.
- Cycle Chart: The four measures across the year.
Requirements
- Microsoft Excel 2016 or later, or Microsoft 365
- Also opens in LibreOffice Calc, Google Sheets (import) and Apple Numbers
- No macros, no add-ins, no internet connection required
Please read
- A measurement tool, not financial, accounting or legal advice.
- Cash released is a one-off benefit, not a recurring saving. It happens once, when the cycle shortens, and reverses if the improvement is not held.
- Seasonal businesses should read the twelve-month average rather than any single month.
- Check the figures against your own ledgers before acting on them.
- Sample data is included and clearly labelled. It is illustrative only.
- This is a tool, not financial, accounting, tax or legal advice.
Frequently Asked Questions
What does the Working Capital Management Template calculate?
It provides a 12-month view of key working capital measures, including Days Sales Outstanding (DSO), Days Inventory Outstanding (DIO), Days Payable Outstanding (DPO), and the Cash Conversion Cycle (CCC). It also analyses working capital, current assets and liabilities, the current ratio and the quick ratio.
What is the cash conversion cycle?
The cash conversion cycle measures how long cash is tied up in business operations before it returns through customer collections. It is calculated as:
CCC = DSO + DIO − DPO
A shorter cycle generally means cash returns to the business more quickly. However, the figures should be considered together with customer collection practices, inventory requirements and agreed supplier payment terms.
How does the template handle the number of days in each month?
The monthly DSO, DIO and DPO calculations use the actual number of calendar days in each month rather than assuming every month has the same length. This helps reflect differences between months, including February and longer months.
Can I estimate how much cash could be released by improving working capital?
Yes. The Improvement Scenario sheet allows you to assess the cash that could be released by achieving target working capital days. This helps quantify the potential benefit of improving collections, inventory efficiency or supplier payment timing.
Does the template calculate potential borrowing-cost savings?
Yes. It estimates annual borrowing-cost savings using the cash released in the improvement scenario and the borrowing rate you enter. The result is an estimate based on your assumptions, not a guaranteed saving.
Does it include current and quick ratio analysis?
Yes. The template includes both ratios to help assess short-term liquidity. The current ratio compares current assets with current liabilities, while the quick ratio focuses on more readily available current assets relative to current liabilities.
Is this a complete cash flow forecast?
No. This workbook focuses on working capital efficiency, liquidity measures and the potential cash impact of improvement targets. It is not a full cash flow forecast covering all operating, investing and financing receipts and payments.
How far ahead does the template analyse working capital?
The workbook provides a 12-month monthly analysis, allowing you to review changes in working capital measures and compare performance across the year.
Reviews
There are no reviews yet.