
A 12-month budget for your household in one workbook: plan each month, enter what really came in and went out, and the Summary shows budget vs actual, overspending flags, your savings rate and how your income splits between needs, wants and savings.
 Download the free workbook (.xlsx)
Designed and tested for Microsoft Excel 2016 or later and Microsoft 365. General information only, not financial advice.
What’s inside
Start Here
A five-step guide, colour key, how every result is calculated, and the live status of your data checks.
Setup
Currency, first month and year, up to 8 income sources and 25 categories, each marked Need, Want or Savings.
Budget
What you plan to earn, spend and save in each category, month by month for 12 months.
Actuals
The same layout for what really happened. Months where you spent more than planned are highlighted.
Summary
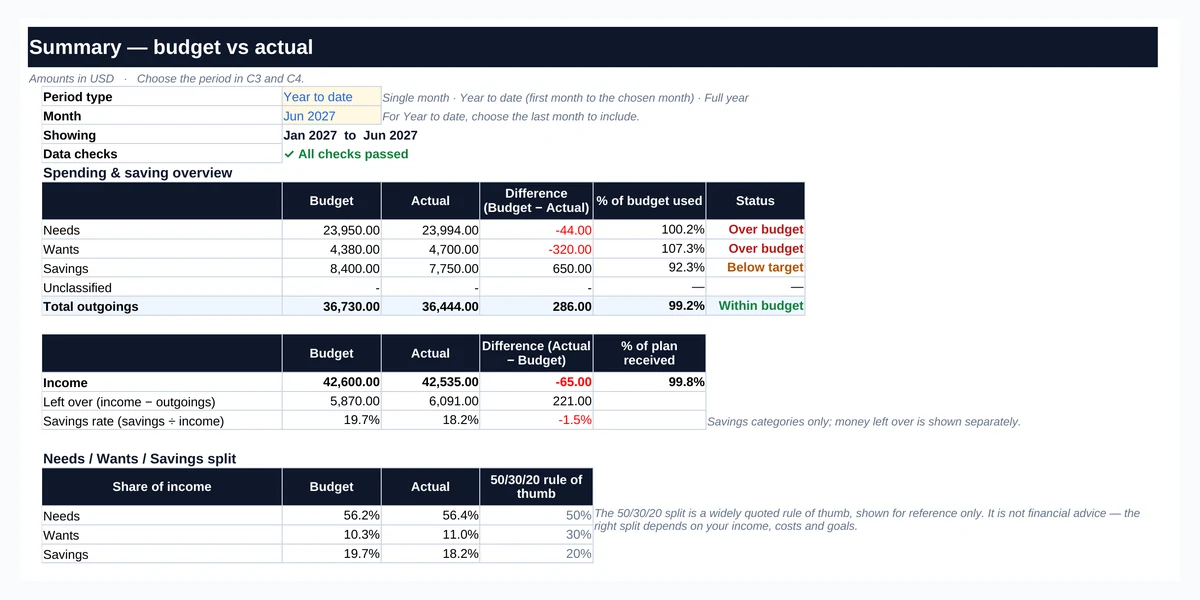
Budget vs actual for a single month, year to date or the full year, with flags, savings rate, your needs/wants/savings split and a monthly chart.
Checks
32 checks for missing types, duplicates, zero income, negative or text entries, and totals that must agree.
How to use it in 5 steps
- Set it up. On Setup, choose your currency and the month your plan starts, list your income sources, and add your categories — marking each one Need, Want or Savings.
- Plan the year. On Budget, enter what you expect each month. Irregular costs such as holidays or annual fees go in the month you expect to pay them.
- Record what happened. Each month, enter what you actually received and spent on Actuals. Monthly totals from your bank statement or an expense log are enough.
- Read the Summary. Pick Single month, Year to date or Full year and the month you want. Each category shows the difference, % of budget used and a flag.
- Confirm the checks. Every check should read OK. If one does not, the Checks sheet says what to fix.
The workbook opens with clearly labelled sample data. To start fresh, select the yellow input cells on Setup, Budget and Actuals and press Delete — the formulas are protected and stay in place.
Worked example: one household, January to June
The sample household plans on 7,100 of income a month from two salaries and some freelance work. Its budget puts about 56% of income towards needs, 10% towards wants and 20% into savings. After six months, the Year-to-date Summary shows:
| Jan–Jun | Budget | Actual | Difference | % used |
|---|---|---|---|---|
| Needs | 23,950.00 | 23,994.00 | −44.00 | 100.2% |
| Wants | 4,380.00 | 4,700.00 | −320.00 | 107.3% |
| Savings | 8,400.00 | 7,750.00 | 650.00 | 92.3% |
| Total outgoings | 36,730.00 | 36,444.00 | 286.00 | 99.2% |
| Income | 42,600.00 | 42,535.00 |
Overall the household is 286.00 under budget, but the detail tells a different story. Wants are 7.3% over, mainly because of an unplanned 350.00 trip in April (flagged Unbudgeted) and dining out running 98.00 over. Meanwhile 650.00 less than planned went into savings, so the savings rate is 18.2% against a planned 19.7%. That is the kind of trade-off a budget is meant to make visible.
How the results are calculated
Difference
Budget − Actual. A positive number means you spent less than planned; for a savings category it is the amount still to save.
% of budget used
Actual ÷ Budget. Shown as “—” when the budget is zero, because a percentage would be meaningless.
Flags
Over budget when actual is above budget, On budget when equal, Near limit once spending reaches 90% of the budget (you can change the level), Unbudgeted for spending with no budget. Savings categories show Target met or Below target instead.
Savings rate
Savings categories ÷ Income for the same period. Money simply left unspent is shown separately as “left over”.
Needs / Wants / Savings split
Each type’s total ÷ income. The 50/30/20 column beside it is a widely quoted rule of thumb, shown for reference only — not a target or advice.
Frequently asked questions
What is a personal budget planner?
A personal budget planner is a plan for how your household’s income will be used each month — on essentials, on optional spending and on saving — compared with what actually happens. Comparing the two each month shows where your money really goes and where the plan needs to change.
What is the 50/30/20 rule?
It is a widely quoted rule of thumb that suggests putting about 50% of after-tax income towards needs, 30% towards wants and 20% towards savings or extra debt repayment. The workbook shows your own split next to it for reference only. It is not financial advice — the right split depends on your income, costs and goals.
Can I start my budget in the middle of the year?
Yes. Choose any first month and year on the Setup sheet, and all 12 months are labelled from there — for example July 2027 to June 2028.
What counts as a need, a want or savings?
Needs are costs you must pay, such as housing, food, utilities, insurance and minimum debt payments. Wants are optional, such as dining out, subscriptions and holidays. Savings are amounts set aside for an emergency fund, retirement, investments or a goal. You decide the type of each category.
Is it compatible with Google Sheets?
The workbook is designed and tested primarily for Excel 2016 or later. Some features may behave differently in other spreadsheet applications.
Is my data private?
Yes. It is a file on your own computer. Nothing you enter is uploaded or sent anywhere, and the workbook contains no macros and needs no internet connection.
Related free tools
Budgeting for a business instead? The Business Budget Planner Template is a paid spreadsheet for business budget vs actual.
This workbook is a planning tool, not financial advice. It does not connect to your bank and only knows what you enter. Written and reviewed by Ghayas Uddin, MS (Finance), financial analyst. Last reviewed 5 October 2026. Found an error? Email support@babadigit.com and we will correct it.