
‘Revenue is up 12%’ is where the board’s questions start, not where they end. Was it price or volume? Did customers trade down to cheaper products? How much came from the range you launched, and how much did you lose from what you dropped? And why did margin not follow?
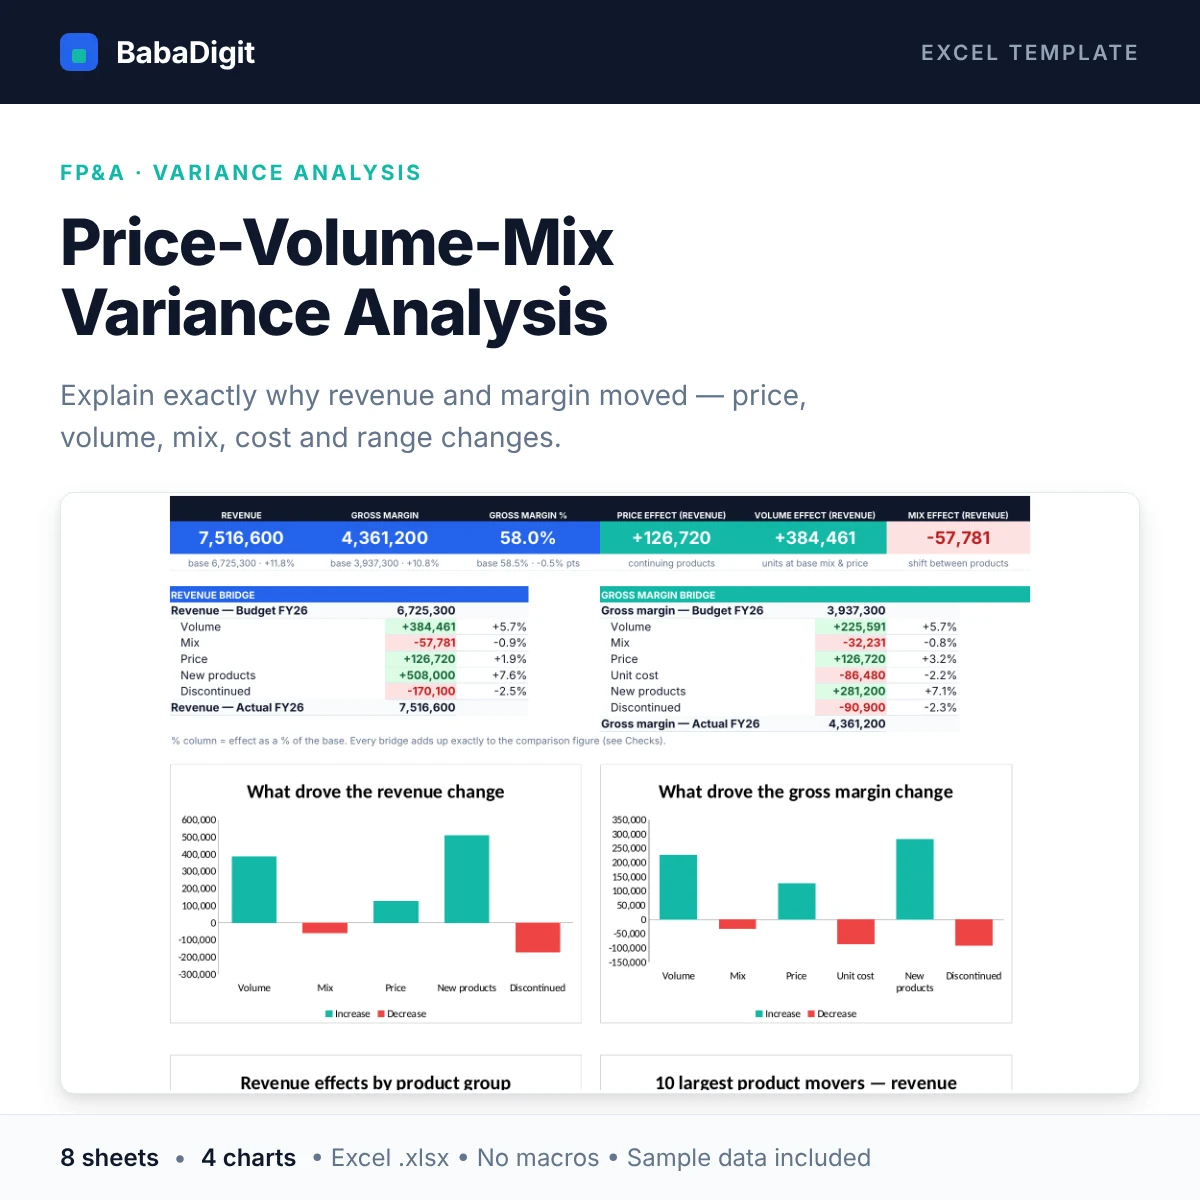
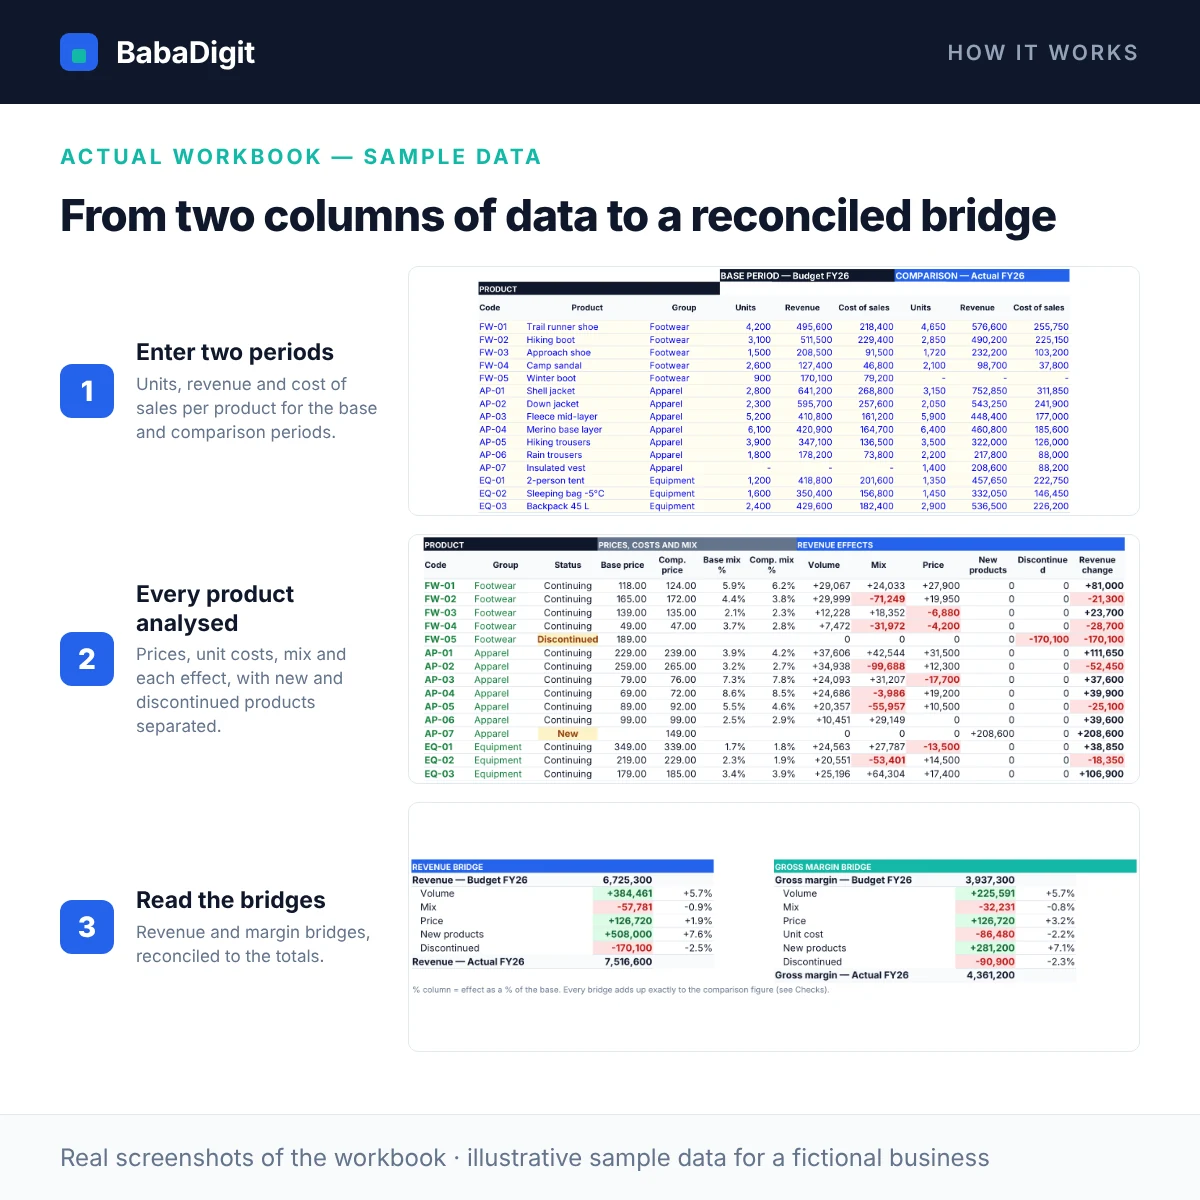
This template answers those questions from a simple product table: units, revenue and cost of sales for a base period (budget, prior year or prior month) and a comparison period. It calculates each product’s price and unit cost, then splits the change into volume, mix and price for continuing products, with new and discontinued products shown as their own effects so they never distort the rest.
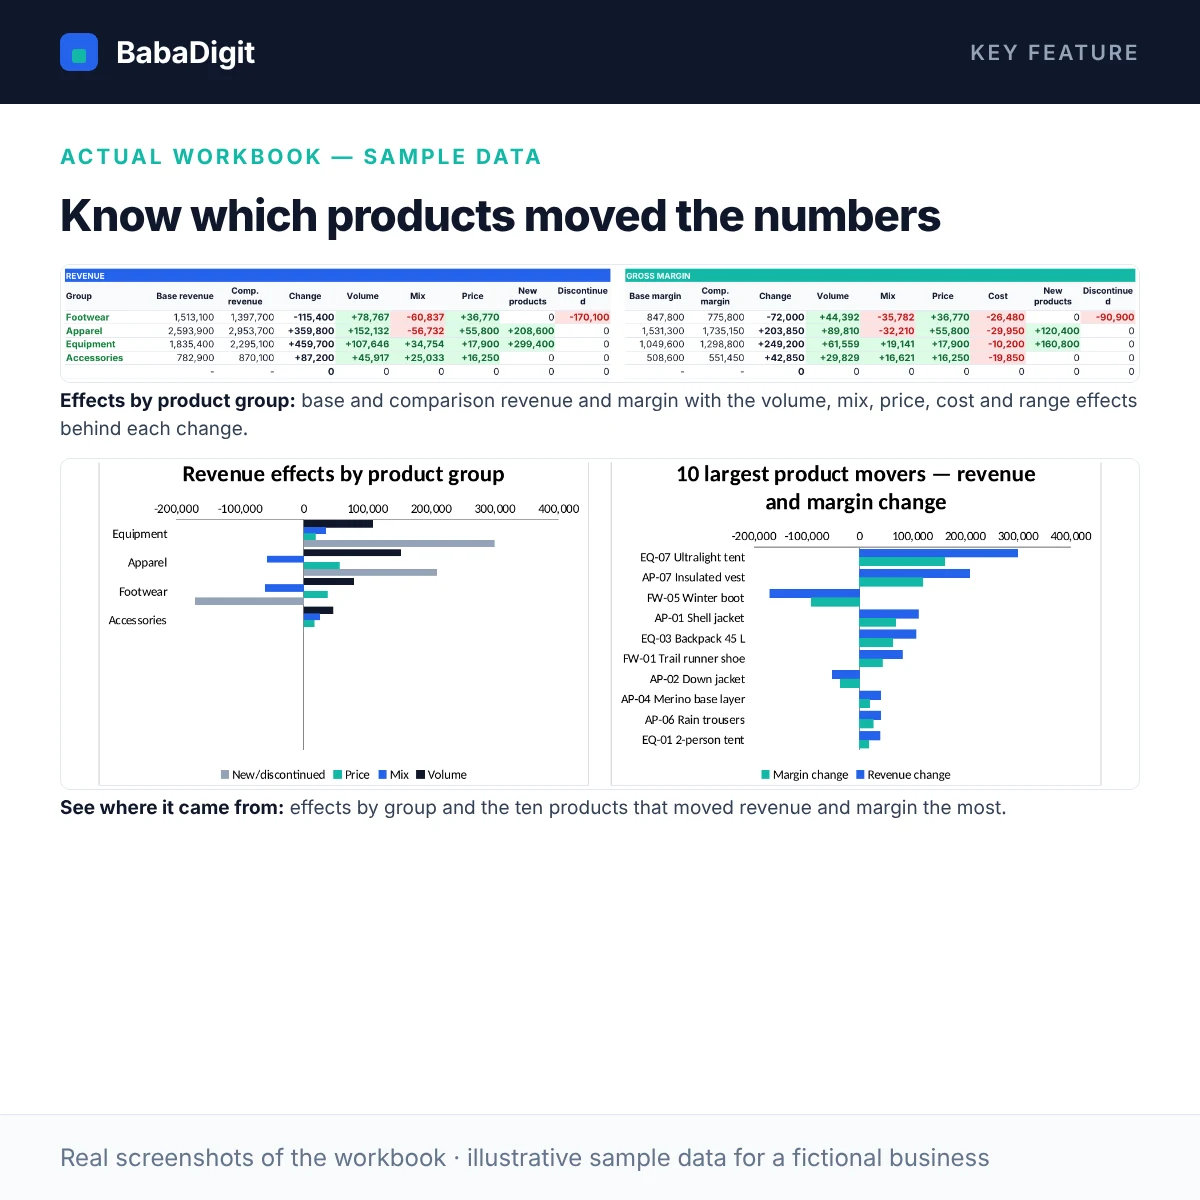
The gross margin bridge adds the unit-cost effect. Group Summary adds up the effects by product group, the Dashboard shows both bridges and the biggest movers, and every bridge is checked back to the actual totals to the cent.
What you get
- Revenue bridge: volume, mix, price, new products and discontinued products
- Gross margin bridge: volume, mix, price, unit cost, new and discontinued products
- Correct treatment of new and discontinued products — kept out of price and mix
- Product-level analysis for up to 300 products, with derived average prices, unit costs and mix shares
- Group Summary for up to 15 product groups, reconciled to the product totals
- Dashboard with six KPIs, both bridges as tables, and four charts: revenue drivers, margin drivers, effects by group, 10 largest product movers
- Works for budget vs actual, prior year vs current year or month vs month — you name the periods
- 9 built-in checks, including three reconciliations, with an overall status
- Macro-free .xlsx with protected formulas and clearly marked input cells
Sheets in the workbook
- Start Here — Purpose, quick start, a live worked example, colour key and navigation.
- Dashboard — Revenue and margin KPIs, both bridges, effects by group and the largest product movers.
- Setup — Period names, currency and product groups.
- Data — Up to 300 products: units, revenue and cost of sales for both periods.
- PVM Analysis — Every product: prices, unit costs, mix and each revenue and margin effect.
- Group Summary — Revenue and margin effects by product group, reconciled to the totals.
- Checks — Data and reconciliation checks with an overall status.
- Notes & Tests — How each effect is calculated, and test scenarios you can run.
Who it is for
FP&A analysts, finance managers, controllers and owners of product businesses who report on revenue and margin performance.
Practical uses
- Month-end and quarter-end performance commentary
- Budget vs actual review with the sales team
- Board and investor reporting on revenue and margin
- Evaluating a price increase after the event
In the download
- BabaDigit_Price_Volume_Mix.xlsx — 8 sheets
- README with the full usage guide
- Licence (own business and client use)
- Worked sample data for a fictional outdoor-gear retailer, clearly labelled
Requirements
- Microsoft Excel 2016 or later, or Microsoft 365
- Also opens in LibreOffice Calc; Google Sheets and Apple Numbers import not yet tested
- No macros, no add-ins, no internet connection required
Please read
- Mix is measured across all continuing products in one step; a separate group-level mix layer is not calculated.
- Currency (FX) effects are not separated — convert both periods at the same rate first for a constant-currency view.
- Revenue and cost of sales must be on the same basis in both periods, and units must be comparable per product.
- This is a tool, not financial, accounting, tax or legal advice.


Reviews
There are no reviews yet.