
A KPI dashboard is only useful if it tells you what to worry about. A grid of numbers does not do that; a status does.
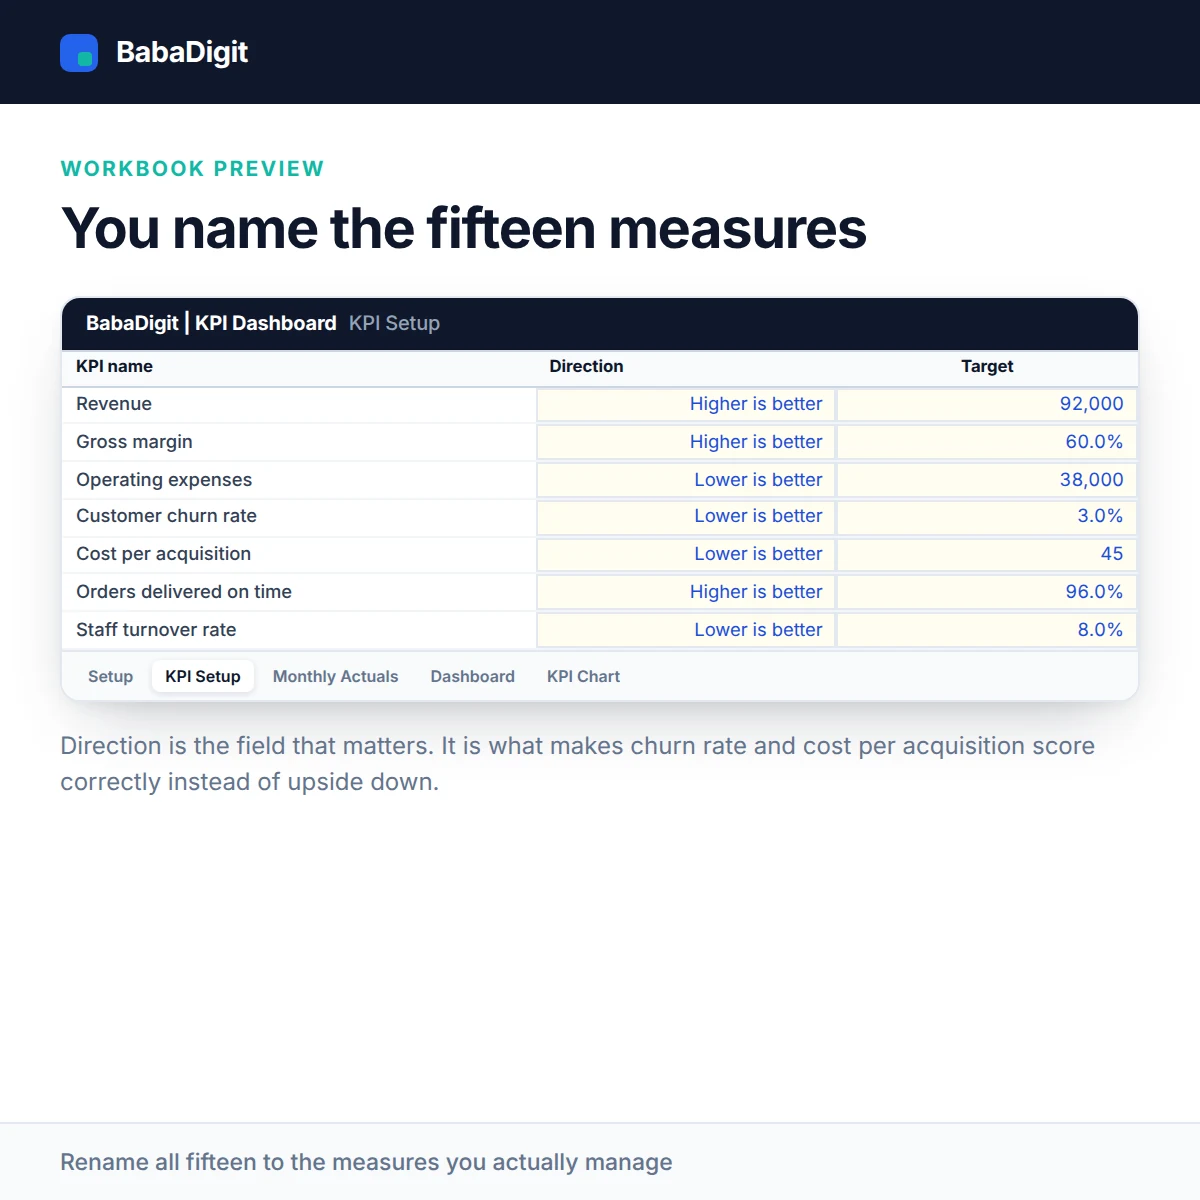
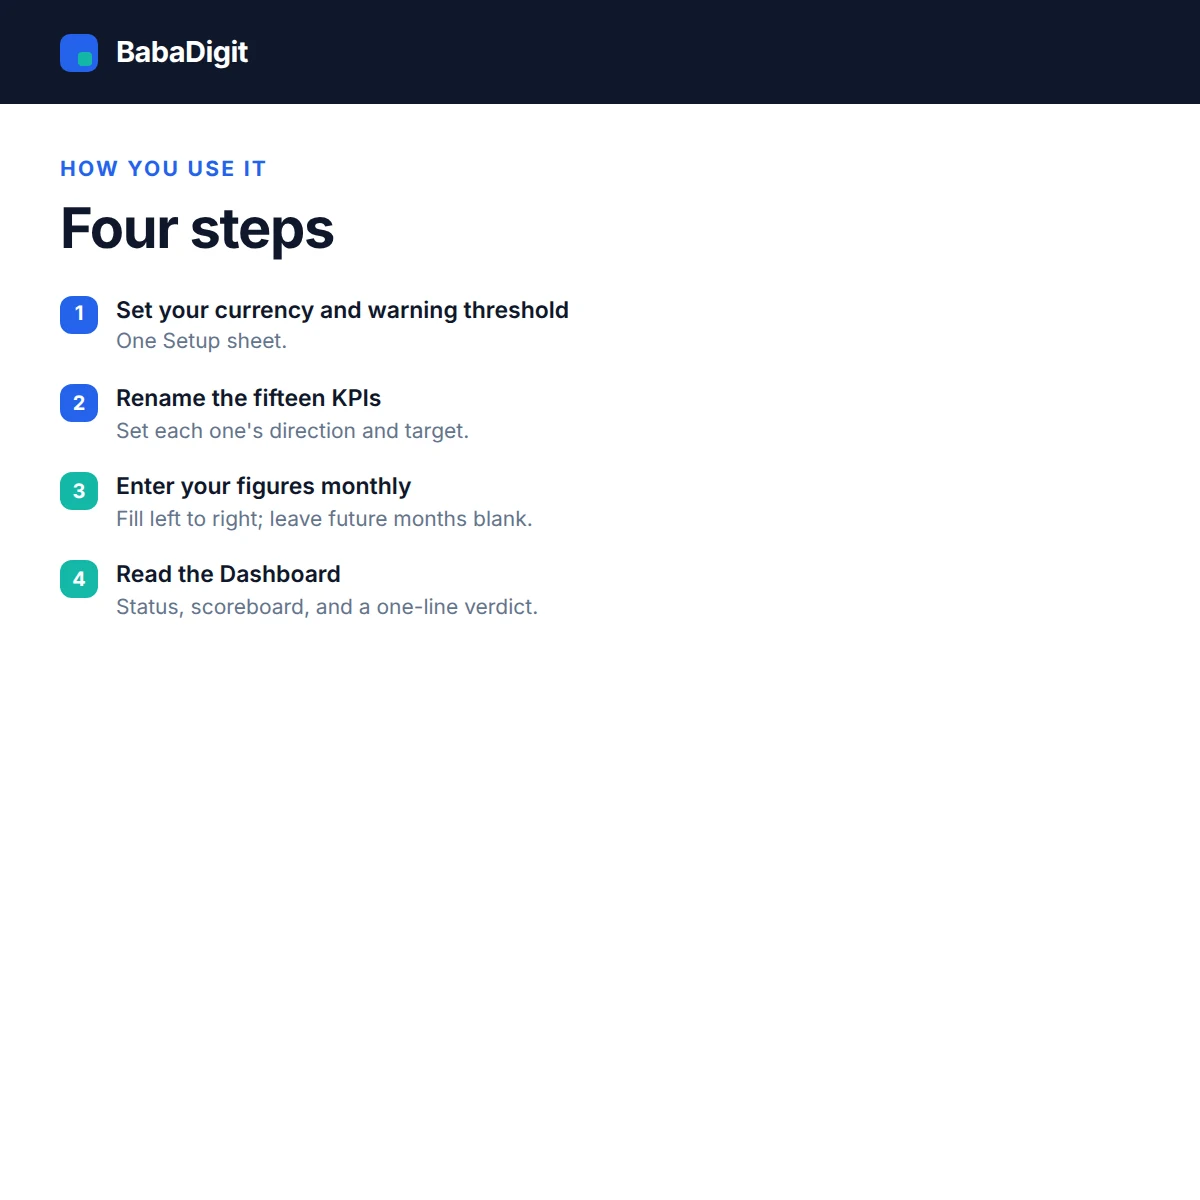
You name the fifteen measures yourself — the template ships with a realistic set across finance, sales, marketing, operations and people, and every one of them is a cell you overwrite. For each, you set a target and say whether higher or lower is the better direction. That second choice is what makes churn rate and cost per acquisition score correctly instead of upside down.
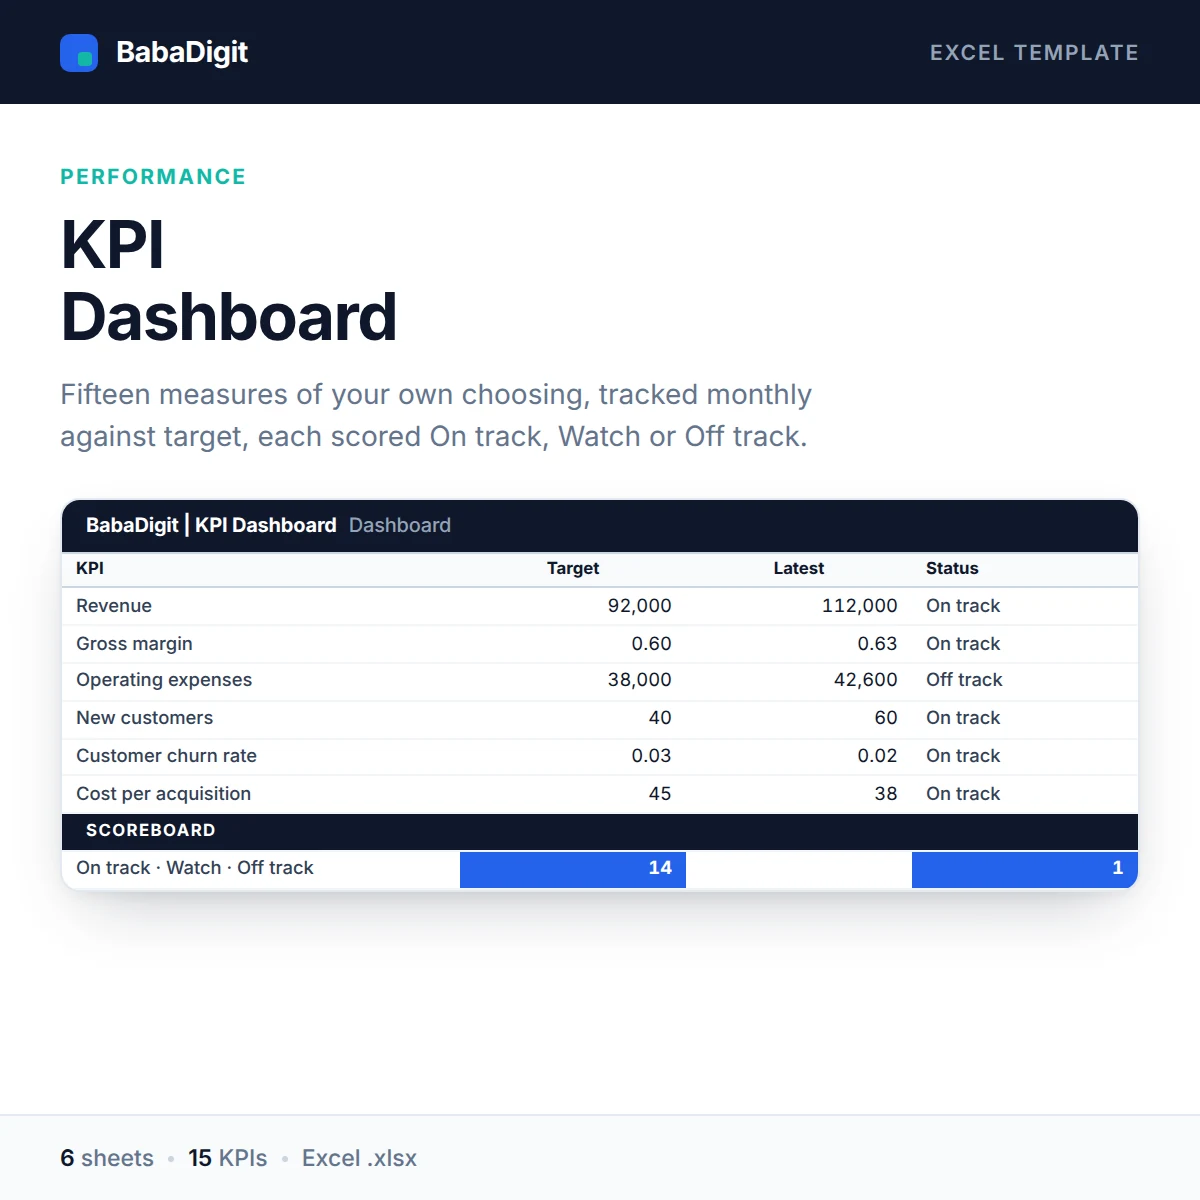
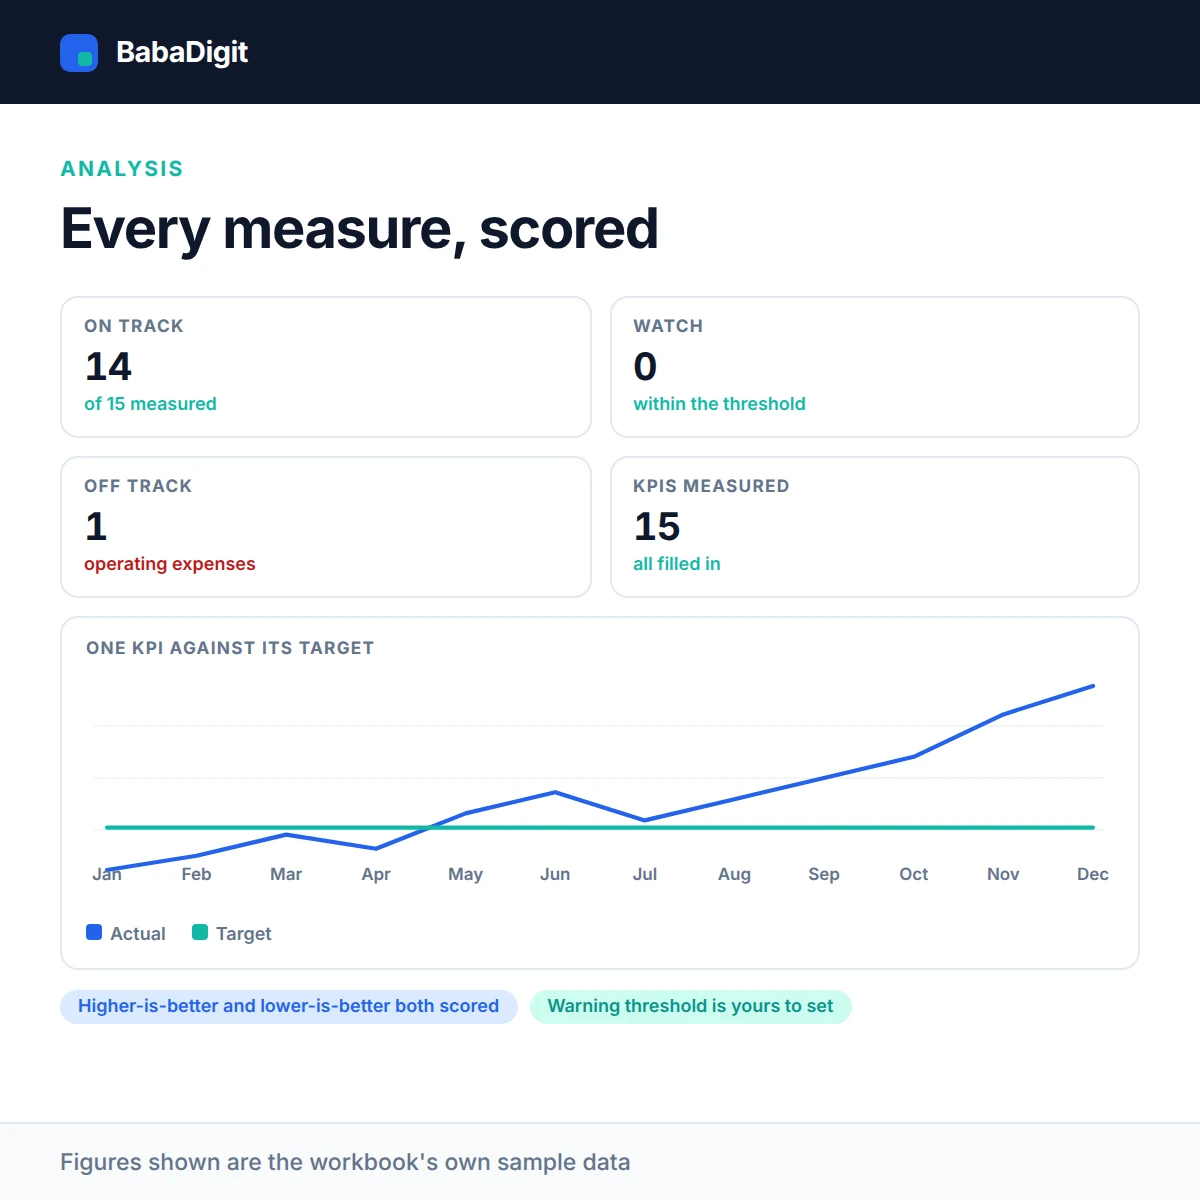
As you fill in months, the Dashboard reads the latest figure and the one before it, and marks every KPI On track, Watch or Off track against a warning threshold you control. A scoreboard counts each status and a one-line verdict names the number that needs attention.
The chart sheet plots any single KPI against its target — type the KPI’s number and the chart follows. An out-of-range number is caught and clamped rather than breaking the sheet.
What you get
- Fifteen fully configurable KPIs with categories and units
- Higher-is-better and lower-is-better scoring
- Configurable warning threshold between Watch and Off track
- Latest, prior month, change, % of target and YTD average
- Status scoreboard and plain-English verdict
- Selectable single-KPI chart with validated input
- Configurable currency — no currency is hard-coded
- No country’s tax rates or statutory rules built in
- Sheets protected without a password
- No macros, no add-ins, no internet connection required
Who it is for
Business owners, managers and team leads who report the same set of numbers every month and want one place to keep them.
In the download
- Excel workbook, fully formula-driven
- README with the full usage guide
- Licence covering commercial and client use
- Worked sample data throughout, clearly labelled
Sheets in the workbook
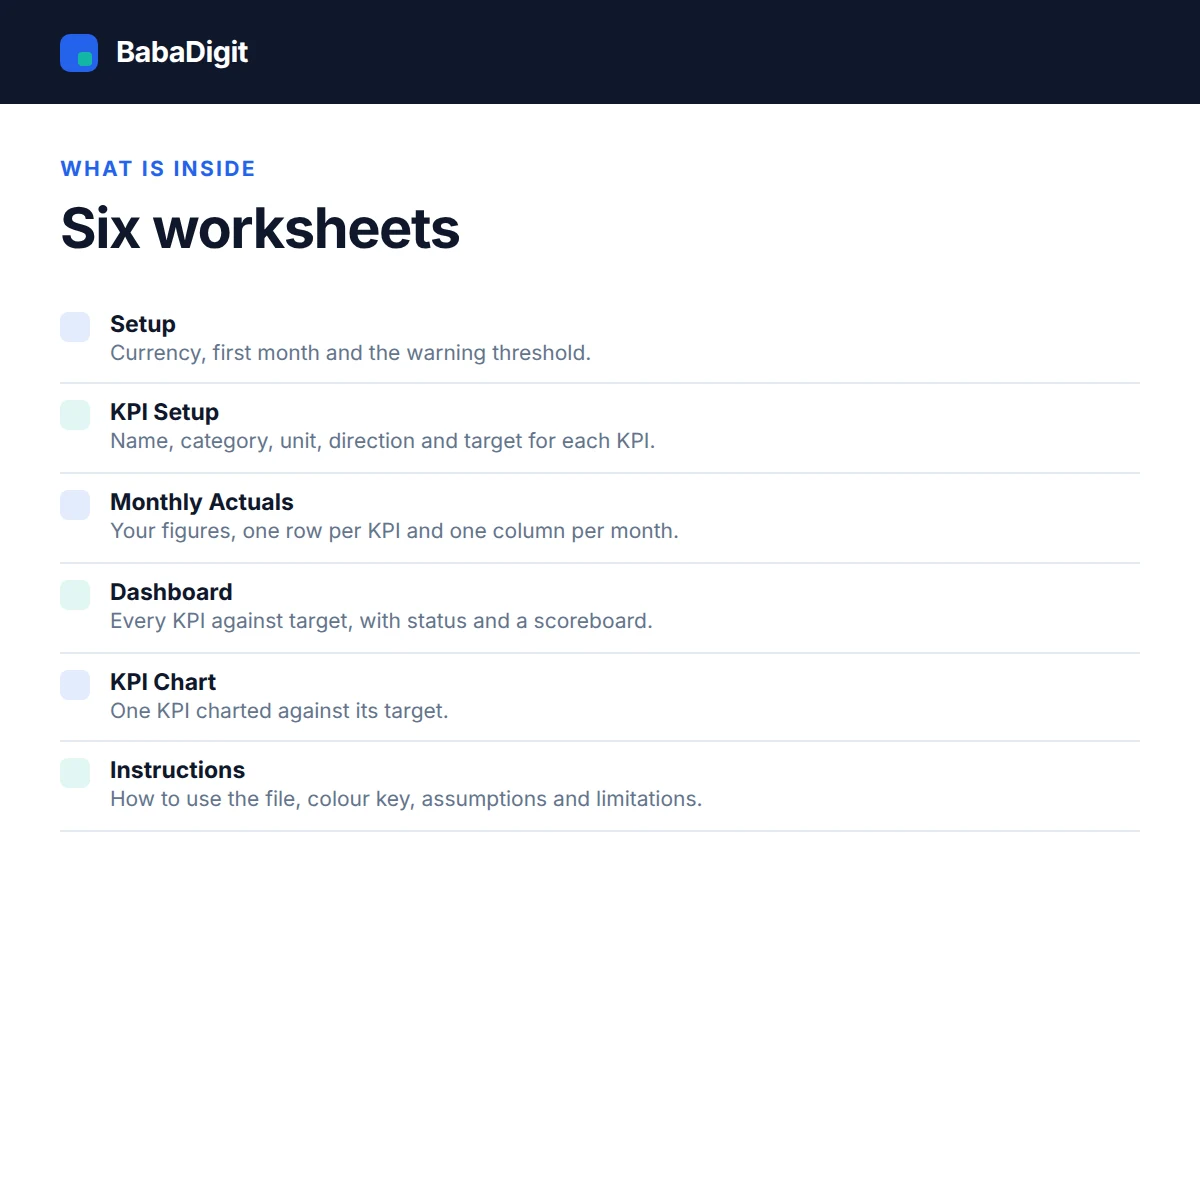
- Instructions — How to use the file, colour key, assumptions and limitations.
- Setup — Currency, first month and the warning threshold.
- KPI Setup — Name, category, unit, direction and target for each KPI.
- Monthly Actuals — Your figures, one row per KPI and one column per month.
- Dashboard — Every KPI against target, with status and a scoreboard.
- KPI Chart — One KPI charted against its target.
Requirements
- Microsoft Excel 2016 or later, or Microsoft 365
- Also opens in LibreOffice Calc, Google Sheets (import) and Apple Numbers
- No macros, no add-ins, no internet connection required
Please read
- A tracking tool. It reports what you enter and does not verify it.
- Fifteen KPI rows are provided. Adding more means extending the Dashboard formulas.
- One column carries every unit, so percentage KPIs display as plain numbers on the Dashboard — read them against the target in the same row.
- General information only, not financial, accounting or management advice.
- Sample data is included and clearly labelled. It is illustrative only.
- This is a tool, not financial, accounting, tax or legal advice.
Reviews
There are no reviews yet.