

Reading this result: revenue grew 30.00% over the period, an increase of 120,000.00. Check what happened to gross margin over the same stretch before treating it as good news.
General information only, not financial advice. Check any figure before you act on it.
Free revenue growth calculator Excel workbook
The same method as the calculator above, in a spreadsheet you can keep, edit and share — with a compounding table and a growth history for up to 36 periods, charted.
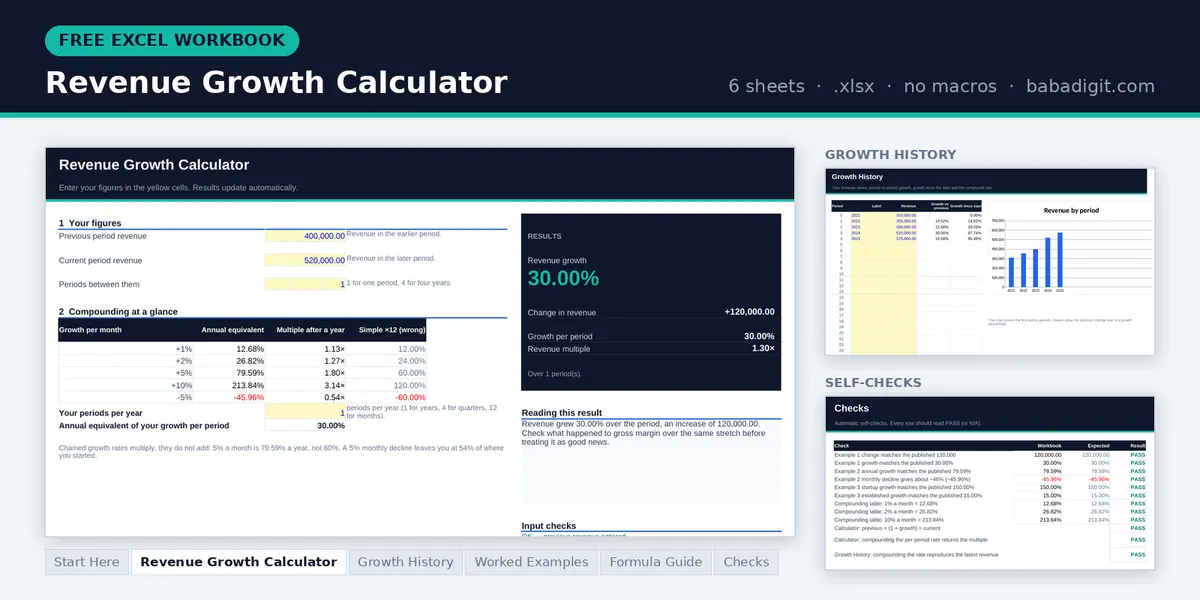
- Revenue Growth Calculator — growth, change in revenue, growth per period, revenue multiple and a compounding table
- Growth History — up to 36 periods with period growth, the compound rate and a chart
- Worked examples — year on year, what 5% a month really means, and the base effect
- Formula guide and checks — the maths in plain English, plus built-in self-tests
Opens in Microsoft Excel or LibreOffice Calc. General information only, not financial advice.
Ready to look forward instead of back? The Sales Forecast Template is a paid spreadsheet that forecasts twelve months of sales by product line, with growth, seasonality and forecast-vs-actual tracking. Browse all templates
What revenue growth actually measures
Revenue growth is the percentage change in sales between two periods. It is the number every business quotes first, and the one most likely to be quoted without the context that makes it meaningful.
The arithmetic is trivial: subtract the old figure from the new one and divide by the old one. The judgement is not. Growth of 30% means something completely different depending on whether it came from selling more, charging more, acquiring a competitor, or a single unusually large order that will not repeat.
It is also the growth measure most vulnerable to the base it started from. Doubling from $50,000 is a rounding error in absolute terms and a spectacular percentage. Tracking the underlying money alongside the percentage keeps you honest.
The revenue growth formulas
Growth (%) = (Current − Previous) ÷ Previous × 100Growth per period over several periods = [(Current ÷ Previous) ^ (1 ÷ periods) − 1] × 100When you are comparing two consecutive periods, the first formula is all you need. When the gap covers several periods, the second one gives the compound rate per period — the same arithmetic as the CAGR calculator. Never divide total growth by the number of periods; that ignores compounding and overstates the rate.
Three worked examples
Year on year
A straightforward comparison
Revenue was $400,000 last year and $520,000 this year.
Growth = 120,000 ÷ 400,000 × 100 = 30.00%
The figure worth pairing this with is gross margin. If margin held steady, the business genuinely grew. If margin fell from 45% to 35% while revenue rose 30%, gross profit barely moved and the extra sales were bought with discounts.
Compounding
What 5% a month really means
A business grows revenue 5% every month for a year. The intuitive annual figure is 60%.
not 5 × 12 = 60%
Compounding adds nearly twenty percentage points. The same effect runs in reverse: a 5% monthly decline is a 46% annual fall, not 60%. Whenever growth rates are chained across periods, multiply them rather than adding.
The base effect
Why percentages flatter small numbers
Two businesses both report growth for the year.
Established: 4,000,000 → 4,600,000 = +15.00% (+600,000)
The startup’s headline is ten times larger; the established business added ten times more money. Neither number is wrong and neither tells the whole story. Always publish the absolute change next to the percentage — it is the single easiest way to keep a growth conversation honest.
Where revenue growth misleads you
Compounding at a glance
| Monthly growth | Annual equivalent | Revenue multiple after a year |
|---|---|---|
| 1% | 12.68% | 1.13× |
| 2% | 26.82% | 1.27× |
| 5% | 79.59% | 1.80× |
| 10% | 213.84% | 3.14× |
Small monthly numbers become large annual ones surprisingly fast. This is also why a modest-sounding monthly decline is so dangerous: losing 5% a month leaves you at 54% of where you started after a year.
How to calculate revenue growth in Excel or Google Sheets
Previous revenue in B1, current in B2, periods in B3:
=(B2-B1)/B1 ← simple growth=(B2/B1)^(1/B3)-1 ← growth per periodFormat as Percentage. For a rolling twelve-month total that removes seasonality, use =SUM(OFFSET(cell,0,0,-12,1)) against your monthly column and compare those totals instead.
Frequently asked questions
What is a good revenue growth rate?
It depends on size and sector. Established small businesses growing 5–10% a year are doing well; early-stage companies are often expected to grow much faster from a small base. The more useful question is whether growth is accelerating or slowing, and whether gross profit is growing at least as fast.
Should I compare month on month or year on year?
Year on year for almost every business, because it cancels out seasonality. Month on month is useful for spotting a turning point quickly, but a single weak month usually reflects the calendar rather than the business. A rolling twelve-month total gives you both: recency without seasonal noise.
Can revenue growth be negative?
Yes, and the calculator handles it. A decline from $500,000 to $420,000 is −16%. Sustained negative growth deserves the same analysis as positive: is it price, volume, lost customers or a single large account that left?
Why does my growth rate fall as the business grows?
Because the base keeps getting larger. Adding $100,000 to a $200,000 business is 50% growth; adding the same $100,000 to a $2,000,000 business is 5%. The absolute progress is identical. This is normal and not in itself a sign of anything wrong.
Should I use gross revenue or net revenue?
Net — after discounts, refunds and returns. Gross revenue overstates growth and hides a rising refund rate, which is exactly the problem you would want the number to reveal. Be consistent across periods, or the comparison is meaningless.
How does revenue growth relate to profit?
Less directly than people assume. Growth only improves profit if gross margin holds and fixed costs do not rise in step. Plenty of businesses have grown revenue substantially while profit stood still or fell, because the extra sales were discounted or required extra overhead to service.
References
- Damodaran, A. Investment Valuation: Tools and Techniques for Determining the Value of Any Asset, 3rd edition, Wiley — on growth rate estimation and sustainable growth.
- Brealey, R. A., Myers, S. C. & Allen, F. Principles of Corporate Finance, 13th edition, McGraw-Hill Education — on growth, compounding and financing needs.
Keep going
Written and reviewed by Ghayas Uddin, MS (Finance), financial analyst. Last reviewed 21 September 2026. Found an error? Email support@babadigit.com and we will correct it.