

Reading this result: a positive ROI means the money came back with 3,500.00 on top. Compare it against what the same money would have earned elsewhere before calling it a win.
General information only, not financial advice. Check any figure before you act on it.
Free ROI calculator Excel workbook
The same method as the calculator above, in a spreadsheet you can keep, edit and share. Every formula is visible, so you can see exactly how each number is worked out.
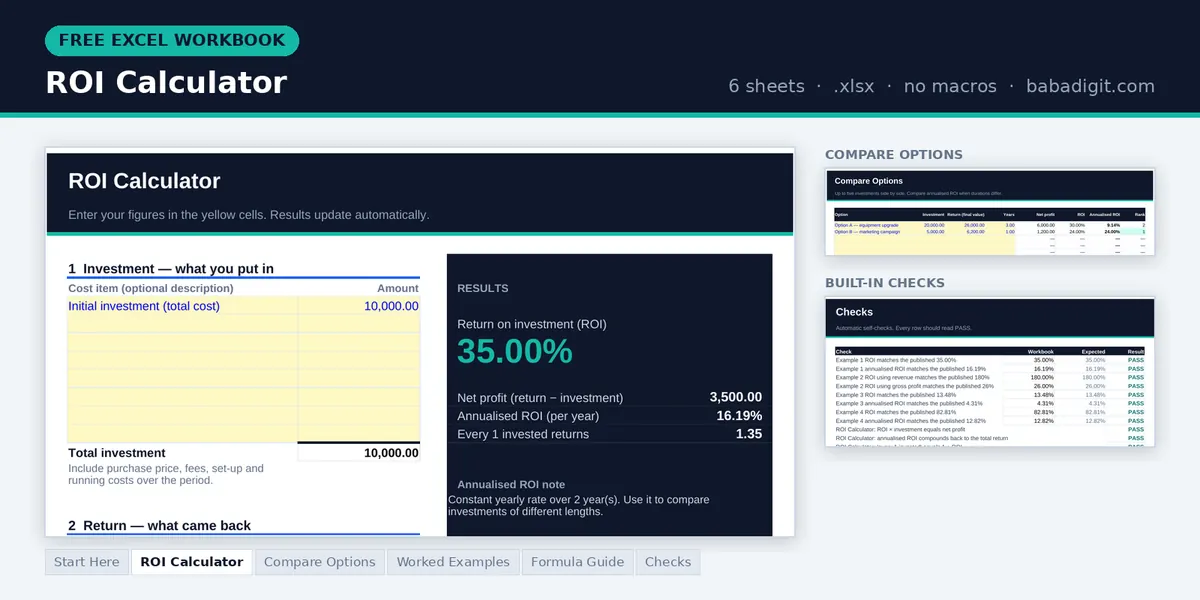
- ROI Calculator — itemise costs and returns; get ROI, net profit, annualised ROI and return per $1
- Compare Options — rank up to five investments side by side
- Worked examples — four cases, from an ad campaign to a rental flat
- Formula guide and checks — the maths in plain English, plus built-in self-tests
Opens in Microsoft Excel or LibreOffice Calc. General information only, not financial advice.
Need more than a single ROI figure? The Financial Model Template is a paid spreadsheet that links a five-year P&L, balance sheet and cash flow from one assumptions sheet. To see ROI in context with other ratios, the Financial Ratio Analysis Template calculates twenty-one financial ratios from one sheet of figures. Browse all templates
What return on investment actually measures
Return on investment states profit as a percentage of what you spent. That single move — dividing by the cost — is what makes it useful, because it puts things that have nothing in common on the same scale. A delivery van, a trade show stand and a new hire all produce a number you can line up side by side.
Say a bakery spends $10,000 on a second oven and, over the next year, that oven produces $13,500 of additional gross profit. The ROI is 35%. The bakery next door spends $400 on a better sign and earns $700 from the extra walk-in trade: an ROI of 75%. In absolute money the oven wins by a distance. As a use of each dollar, the sign is more than twice as efficient. Both facts are true, and ROI is the one that tells you where the next dollar should go.
What it deliberately leaves out matters just as much. ROI does not know when the money arrived, so a return earned over ten years looks identical to the same return earned in one. It does not know how risky the investment was, so a government bond and a friend’s startup are treated as equals. And it only counts what you told it to count — leave out installation, training or your own time, and the percentage comes back flattering and wrong.
The ROI formula
ROI (%) = (Final value − Initial investment) ÷ Initial investment × 100Annualised ROI (%) = [(Final value ÷ Initial investment) ^ (1 ÷ years) − 1] × 100Use the plain formula when you are comparing things that ran for the same length of time. Use the annualised version the moment the periods differ — otherwise the longer investment wins simply by having had more time, which tells you nothing about which was the better decision.
Three worked examples
Marketing
A paid advertising campaign
A shop spends $4,000 on ads. The campaign is tracked to $11,200 of sales. Gross margin on those products is 45%.
ROI = (11,200 − 4,000) ÷ 4,000 × 100 = 180%
The honest version, using gross profit:
Gross profit = 11,200 × 0.45 = 5,040
ROI = (5,040 − 4,000) ÷ 4,000 × 100 = 26%
The gap between 180% and 26% is the single most common error in marketing ROI. Revenue is not return — the goods had to be bought before they could be sold. Put gross profit in the return, never top-line revenue, unless your product costs you nothing to deliver.
Equipment
A second delivery van
A van costs $28,000. Fuel, insurance and servicing run to $16,500 across three years. The extra deliveries generate $41,500 of additional gross profit, and the van sells for $9,000 at the end.
Total returned = 41,500 + 9,000 = 50,500
Net profit = 50,500 − 44,500 = 6,000
ROI = 6,000 ÷ 44,500 × 100 = 13.48%
Annualised = [(50,500 ÷ 44,500) ^ (1 ÷ 3) − 1] × 100 = 4.31% a year
Two lessons sit in this example. Running costs belong in the investment — they are money you had to spend to get the return. And resale value belongs in the return, because you get it back. Notice what annualising does: 13.48% sounds respectable until you see it is 4.31% a year, which a business owner should weigh against far safer uses of $44,500.
Property
A rental flat bought with a mortgage
A buyer puts down a $60,000 deposit plus $4,000 in legal and survey fees. Net rent after all costs is $5,400 a year. After five years the flat sells, and once the outstanding mortgage is repaid, $90,000 of equity comes back.
Cash returned = (5,400 × 5) + 90,000 = 117,000
Net profit = 117,000 − 64,000 = 53,000
ROI = 53,000 ÷ 64,000 × 100 = 82.81%
Annualised = [(117,000 ÷ 64,000) ^ (1 ÷ 5) − 1] × 100 = 12.82% a year
This is cash-on-cash return, and the number looks strong because the denominator is only the buyer’s own money — the bank supplied the rest. Borrowing magnifies ROI in both directions. Run the same sums on a flat that fell in value and the leverage that produced 82.81% will produce a loss far larger than the fall in price.
Where ROI misleads you
ROI, ROE and ROA compared
| Measure | Question it answers | What you divide by | Best used for |
|---|---|---|---|
| ROI | Did this particular decision pay off? | Money you put in | Projects, campaigns, purchases |
| ROE | Is the business rewarding its owners? | Shareholder equity | Whole companies |
| ROA | Is the asset base working hard enough? | Total assets | Asset-heavy businesses |
The three are the same idea pointed at different denominators. ROI is the flexible one, which is also its weakness: because you choose what goes into the investment figure, two people can calculate a different ROI for the same project and both be defensible. ROE and ROA take their denominators from the accounts, so they are harder to argue with and easier to compare between companies.
How to calculate ROI in Excel or Google Sheets
Put the cost in B1, the final value in B2 and the number of years in B3. Then:
=(B2-B1)/B1=(B2/B1)^(1/B3)-1 ← annualisedFormat both cells as Percentage rather than multiplying by 100 — that way the cell holds the true value and only the display changes, which keeps any later calculation correct. If the cost cell might be empty, wrap it in an IF so an empty cost returns a blank instead of a division error.
Frequently asked questions
What counts as a good ROI?
There is no universal threshold, because the right benchmark is whatever else you could have done with the same money at the same risk. A useful test: compare the annualised ROI against your cost of borrowing, and against a low-risk alternative available to you. A 9% annual return is excellent if your alternative was 3%, and poor if the project carried real risk of total loss.
Should the return be revenue or profit?
Profit, in almost every case. Revenue ignores what it cost to deliver the goods or services, which inflates the result — often by a factor of five or more, as the marketing example above shows. Use gross profit for campaigns and product decisions, and net profit when overheads change as a direct result of the investment.
Can ROI be negative?
Yes. A negative ROI means the investment returned less than it cost. −25% means a quarter of the money did not come back. The floor is −100%, which is a total loss — you cannot lose more than you invested, unless you borrowed to invest, in which case the loss on your own cash can exceed 100%.
ROI or IRR — which should I use?
Use ROI when money goes in once and comes back once, and you want a figure anyone can follow. Use IRR when cash moves in and out repeatedly over several years, because IRR accounts for the timing of every individual cash flow. IRR is more accurate for multi-year projects; ROI is easier to explain and harder to misread.
How do I annualise an ROI?
Divide the final value by the initial investment, raise the result to the power of one divided by the number of years, then subtract one. Do not simply divide the total ROI by the number of years — that ignores compounding and overstates long returns.
What should I include in the initial investment?
Every cost you would not have paid had you not gone ahead: the purchase price, delivery, installation, fees, training, and any ongoing running costs over the period you are measuring. If a cost would have existed anyway, leave it out. The test is whether the money moved because of this decision.
References
- Brealey, R. A., Myers, S. C. & Allen, F. Principles of Corporate Finance, 13th edition, McGraw-Hill Education — on investment appraisal and why timing changes the answer.
- Damodaran, A. Investment Valuation: Tools and Techniques for Determining the Value of Any Asset, 3rd edition, Wiley — on return measures and their limitations.
Keep going
Written and reviewed by Ghayas Uddin, MS (Finance), financial analyst. Last reviewed 21 September 2026. Found an error? Email support@babadigit.com and we will correct it.