

Reading this result: 10.00 cents of every sales dollar reaches the bottom line. Direct costs take 60.00 cents, overheads take 24.00, and interest and tax take the rest.
General information only, not financial advice. Check any figure before you act on it.
Free profit margin calculator Excel workbook
The same method as the calculator above, in a spreadsheet you can keep, edit and share — with the full profit ladder and a twelve-month margin trend chart.
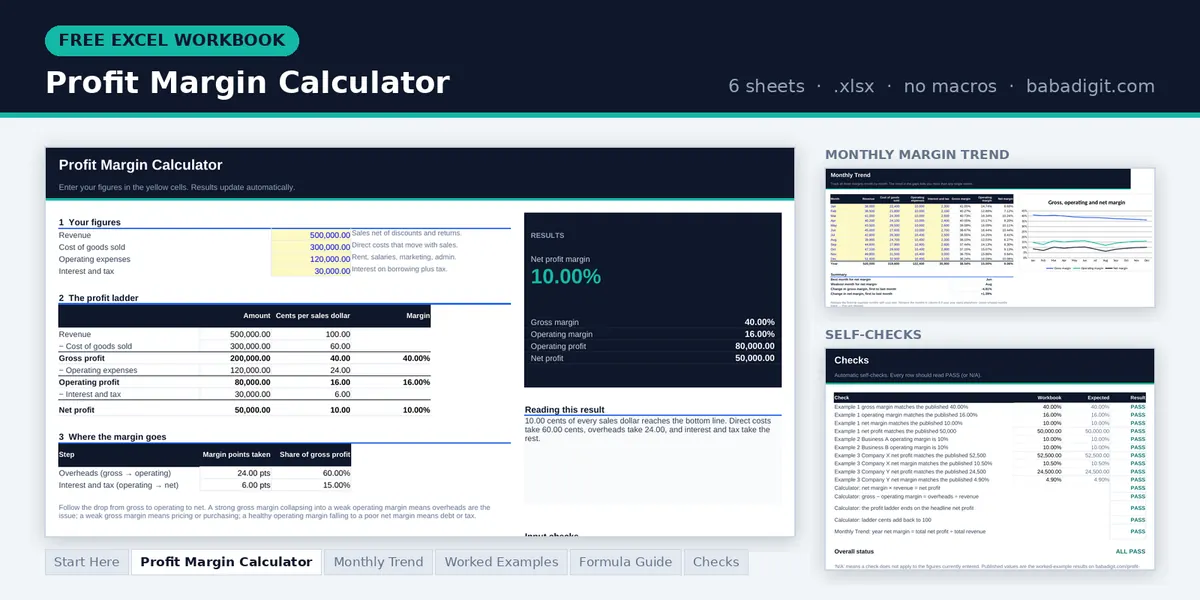
- Profit Margin Calculator — net, gross and operating margin, with the profit ladder in cents per sales dollar
- Monthly Trend — twelve months of all three margins, with a chart
- Worked examples — one business, three margins; two businesses at 10%; what debt does to net margin
- Formula guide and checks — the maths in plain English, plus built-in self-tests
Opens in Microsoft Excel or LibreOffice Calc. General information only, not financial advice.
Want the margins to come straight out of your accounts? The Profit & Loss Statement Template is a paid spreadsheet that builds a twelve-month P&L with gross, EBITDA and net margin for every month. To track margins together with other key ratios, the Financial Ratio Analysis Template calculates twenty-one financial ratios from one sheet of figures. Browse all templates
What profit margin actually measures
Profit margin is the share of revenue that survives to become profit. The word on its own is ambiguous, because a profit and loss account produces three of them, and they answer three different questions.
Gross margin is what is left after the direct cost of delivering the sale. Operating margin is what is left after overheads as well — the truest measure of whether the business model works. Net margin is what remains once interest and tax have taken their share, and is what the owners actually keep.
Reading all three together is what makes them useful, because the gaps between them point at the problem. A strong gross margin collapsing into a weak operating margin means overheads are the issue. A weak gross margin means pricing or purchasing. A healthy operating margin falling to a poor net margin means debt or tax.
The three formulas
Gross margin = (Revenue − COGS) ÷ Revenue × 100Operating margin = (Revenue − COGS − Operating expenses) ÷ Revenue × 100Net margin = (Revenue − all costs, interest and tax) ÷ Revenue × 100Revenue is the denominator in all three, which is what makes them directly comparable down the page. Each one simply subtracts more from the top.
Three worked examples
The full picture
One business, three margins
Revenue of $500,000, cost of goods sold $300,000, overheads $120,000, interest and tax $30,000.
Operating profit = 200,000 − 120,000 = 80,000 → 16.00%
Net profit = 80,000 − 30,000 = 50,000 → 10.00%
Follow the drop: 40 to 16 to 10. Each step tells you where the money goes. Overheads consume 24 points of margin here — more than half of everything the gross margin earned.
Same result, different problem
Two businesses at 10% operating margin
Both turn over $500,000 and both reach a 10% operating margin. They need entirely different interventions.
Business B: gross margin 25% (125,000), overheads 75,000 → 10%
A has plenty of margin and an overhead problem — there is room to cut. B is running lean but selling too cheaply; cutting costs further will not help, and a small price rise would transform it. An operating margin alone would never tell you which company you were looking at.
Below the line
What debt does to net margin
Two companies each earn $80,000 operating profit on $500,000 of revenue. One is lightly borrowed, the other heavily. Tax is 30% of what is left.
Company Y: interest 45,000 → taxable 35,000 → tax 10,500 → net 24,500 (4.90%)
Identical operations, less than half the net margin. This is why operating margin is the fairer comparison between two businesses, and why net margin is the more honest one for the owner — the interest is real money leaving the business every month.
Where profit margin misleads you
The three margins side by side
| Margin | Subtracts | Tells you about | Fix if it is weak |
|---|---|---|---|
| Gross | Direct costs | Pricing and purchasing | Raise prices, cut input costs |
| Operating | Plus overheads | Whether the model works | Reduce fixed costs, grow volume |
| Net | Plus interest and tax | What owners keep | Cut debt, plan tax properly |
How to calculate profit margins in Excel or Google Sheets
Revenue in B1, COGS in B2, overheads in B3, interest and tax in B4:
=(B1-B2)/B1 ← gross=(B1-B2-B3)/B1 ← operating=(B1-B2-B3-B4)/B1 ← netPut all three in a column next to each other and chart them monthly. The trend in the gaps between them is far more informative than any single month’s figure.
Frequently asked questions
What is a good profit margin?
It depends completely on the industry, and on which margin you mean. Net margins of 2–3% are normal in grocery and construction; 10–20% is strong in most services; software can exceed 25%. Your own trend over time is a far more useful signal than any published benchmark.
Which margin should I track month to month?
Gross margin, because it reacts fastest to the decisions you control — pricing, discounting, supplier costs and product mix. Operating and net margin move more slowly and are affected by timing, accruals and tax. Watch gross weekly or monthly, the others quarterly.
Why is my net margin so much lower than my gross margin?
Because overheads, interest and tax sit between them. A wide gap is normal; a widening gap is the warning sign. If gross margin is holding steady while net margin falls, the problem is below the gross profit line — usually overheads that grew while revenue did not.
Can profit margin be over 100%?
Not from trading. A margin above 100% would mean profit exceeded revenue, which only happens when something other than sales is included — a one-off gain, an asset sale or an accounting adjustment. If you see one, the numerator contains something that does not belong there.
Should I include owner salary in the costs?
Yes, at a market rate for the work done. Leaving it out makes the business look more profitable than it is and produces a figure you cannot compare with anyone else. If the business cannot pay a market salary and still show a margin, that is important information.
Margin or markup?
Margin measures profit against the selling price; markup measures it against cost. Profit margins in accounts are always margins. If someone quotes you a percentage while talking about pricing, check which they mean — the markup calculator converts between them.
References
- Brealey, R. A., Myers, S. C. & Allen, F. Principles of Corporate Finance, 13th edition, McGraw-Hill Education — on profitability ratios and their interpretation.
- Horngren, C. T., Datar, S. M. & Rajan, M. V. Cost Accounting: A Managerial Emphasis, 16th edition, Pearson — on cost structure and margin analysis.
Keep going
Written and reviewed by Ghayas Uddin, MS (Finance), financial analyst. Last reviewed 21 September 2026. Found an error? Email support@babadigit.com and we will correct it.