
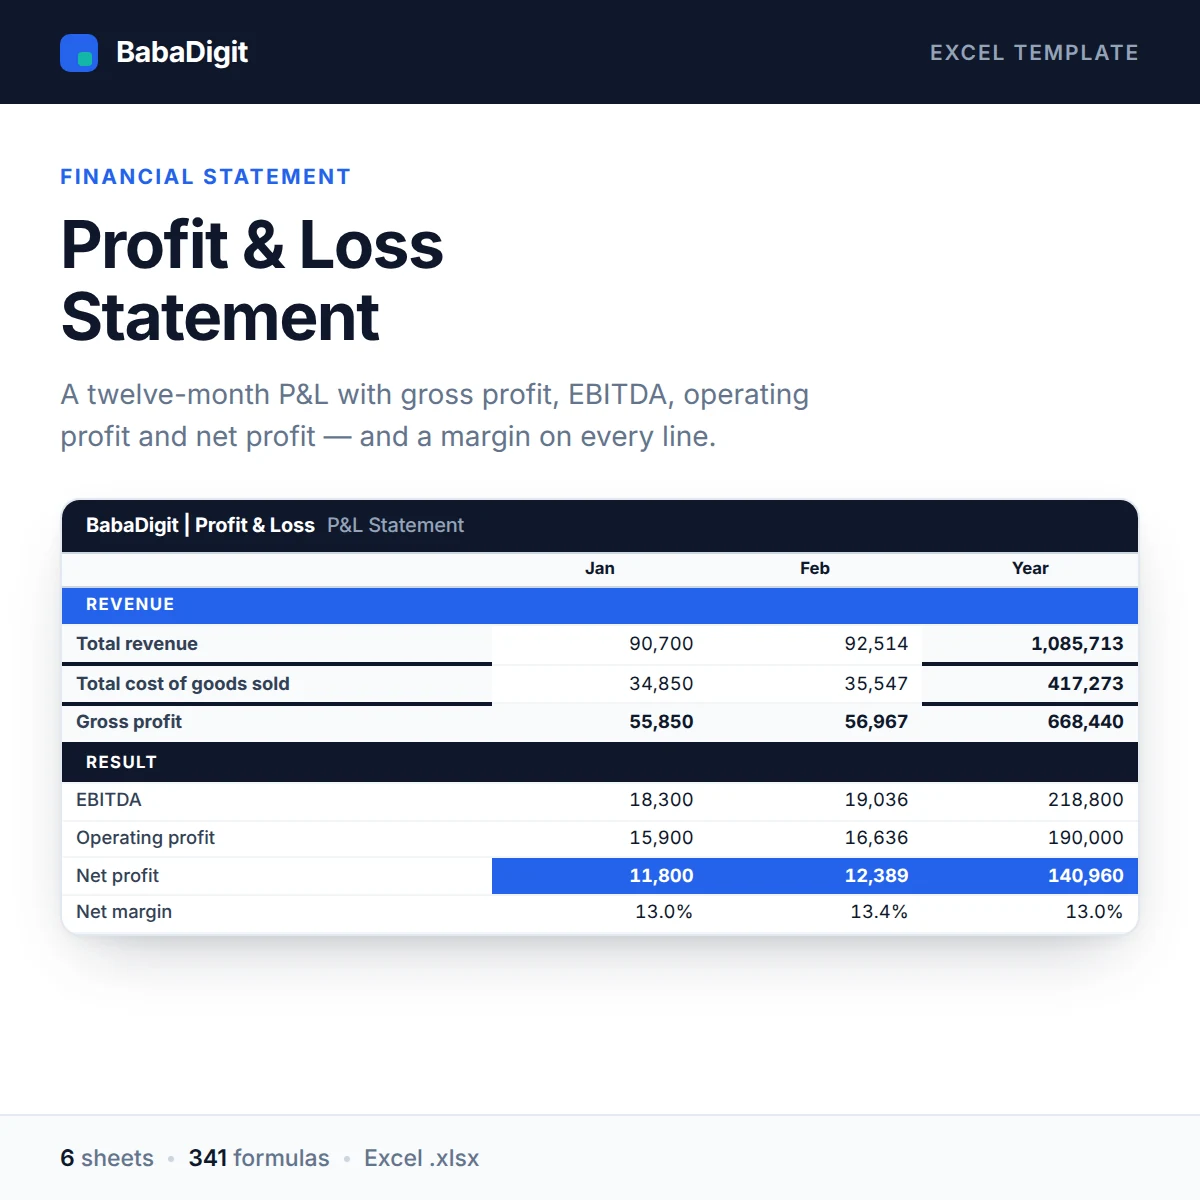

Most small businesses have a bookkeeping system that produces a P&L and no idea how to read it. This template does the opposite: one sheet to fill in, and a statement laid out the way a lender, an investor or an accountant expects to see it.
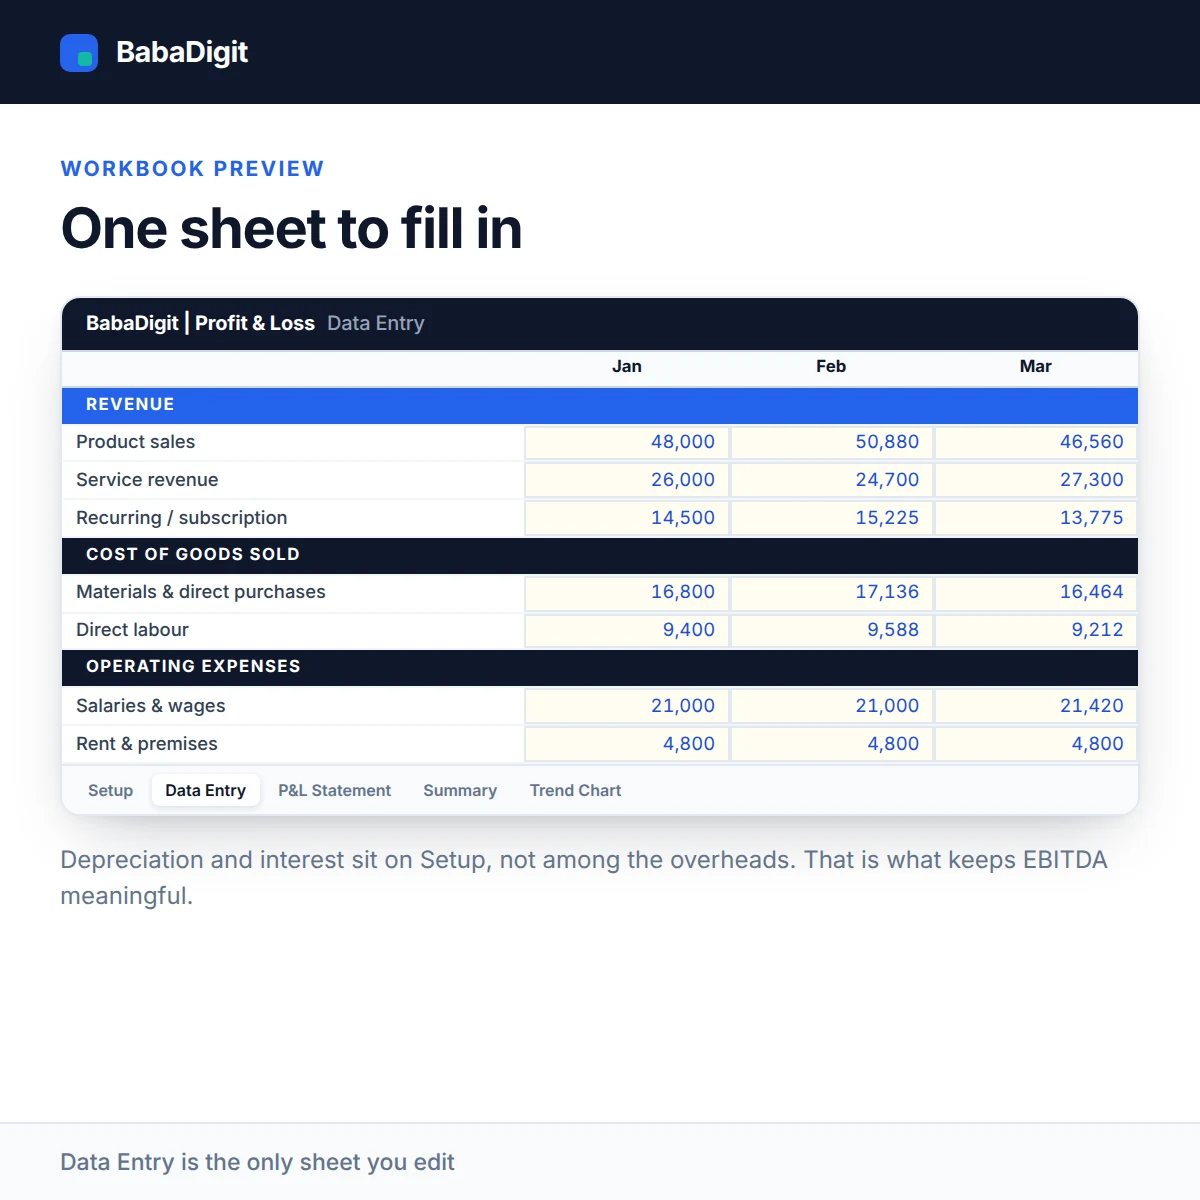
Revenue, cost of sales and overheads are entered month by month on a single Data Entry sheet. Everything else calculates. Depreciation and interest sit on the Setup sheet rather than among the overheads, which is what keeps EBITDA meaningful.
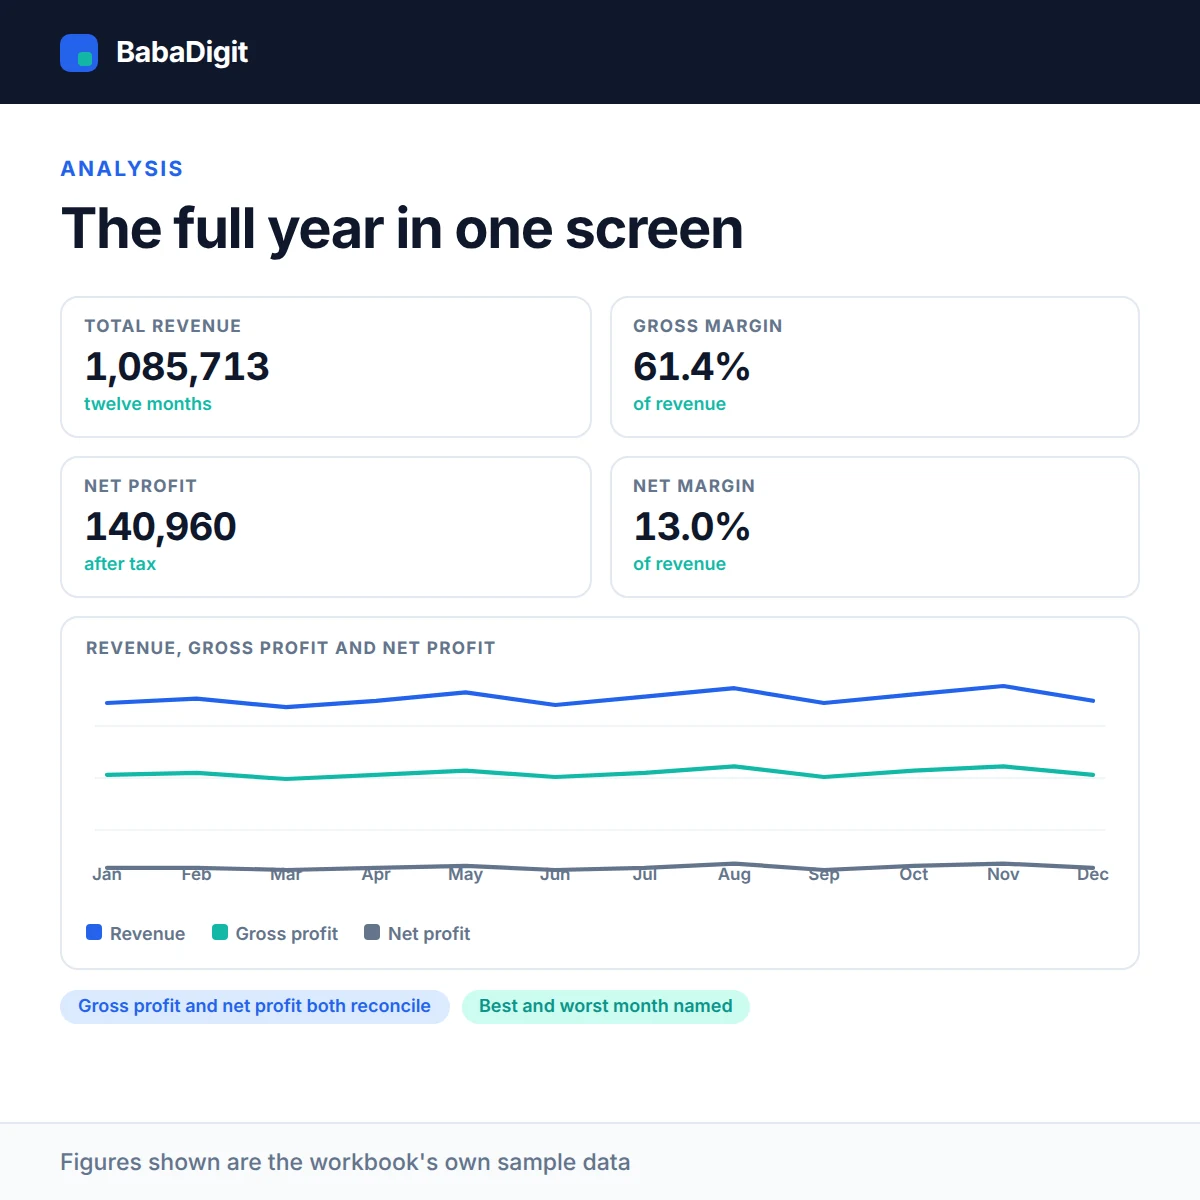
The Summary sheet gives you the full year in one screen, with the margins and the best and worst trading months. The Trend Chart shows revenue against gross and net profit, so a bad month is visible rather than buried in a column of numbers.
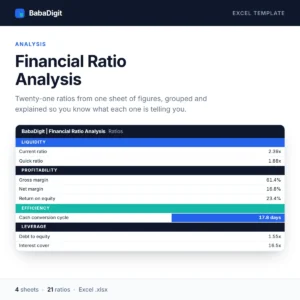
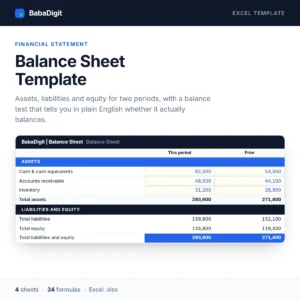
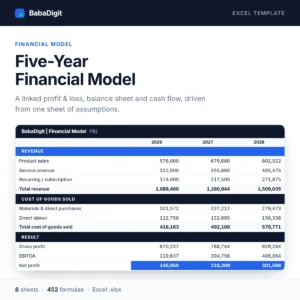
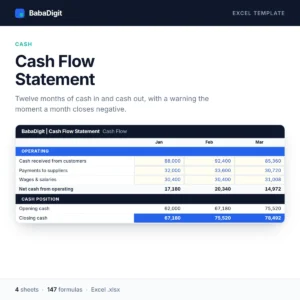
It shares its chart of accounts with the BabaDigit Balance Sheet, Cash Flow and Ratio Analysis templates, so the four reconcile against one another.
What you get
- Twelve-month statement driven by one date cell
- Four revenue lines, five cost of sales lines, eleven overhead lines
- Gross profit, EBITDA, operating profit, profit before tax, net profit
- Gross, EBITDA and net margin for every month
- Full-year summary with best and worst months
- Revenue and profit trend chart
- Configurable currency — no currency is hard-coded
- No country’s tax rates or statutory rules built in
- Sheets protected without a password
- No macros, no add-ins, no internet connection required
Who it is for
Business owners, bookkeepers and finance managers who need a monthly P&L that reads like an accountant’s, without building one from scratch.
In the download
- Excel workbook, fully formula-driven
- README with the full usage guide
- Licence covering commercial and client use
- Worked sample data throughout, clearly labelled
Sheets in the workbook
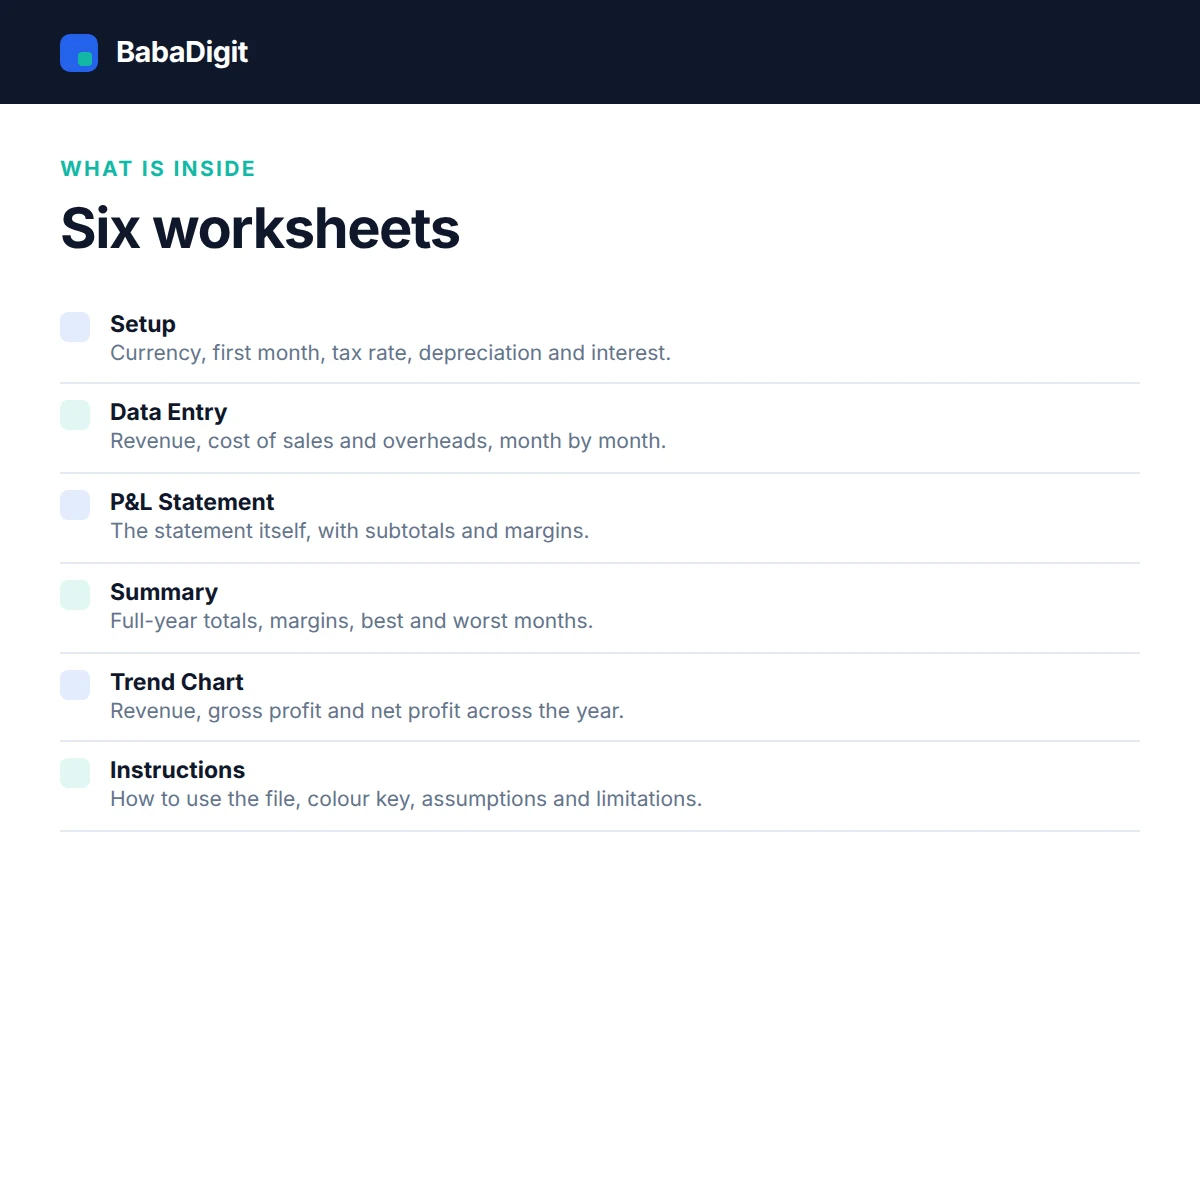
- Instructions — How to use the file, colour key, assumptions and limitations.
- Setup — Currency, first month, tax rate, depreciation and interest.
- Data Entry — Your revenue, cost of sales and overheads, month by month.
- P&L Statement — The statement itself, with subtotals and margins.
- Summary — Full-year totals, margins and the best and worst months.
- Trend Chart — Revenue, gross profit and net profit across the year.
Requirements
- Microsoft Excel 2016 or later, or Microsoft 365
- Also opens in LibreOffice Calc, Google Sheets (import) and Apple Numbers
- No macros, no add-ins, no internet connection required
Please read
- A management P&L, not a statutory or filed set of accounts.
- No country’s tax rules, allowances or accounting standards are built in.
- It reports what you enter and cannot verify your bookkeeping.
- General information only, not financial, tax or accounting advice.
- Sample data is included and clearly labelled. It is illustrative only.
- This is a tool, not financial, accounting, tax or legal advice.
Reviews
There are no reviews yet.