

Reading this result: growing at 31.95% every single year for 5 years would produce exactly this outcome. The real path almost certainly looked nothing like that.
General information only, not financial advice. Check any figure before you act on it.
Free CAGR calculator Excel workbook
The same method as the calculator above, in a spreadsheet you can keep, edit and share — with the smoothed growth path year by year, an actual-versus-smoothed chart and a side-by-side comparison.
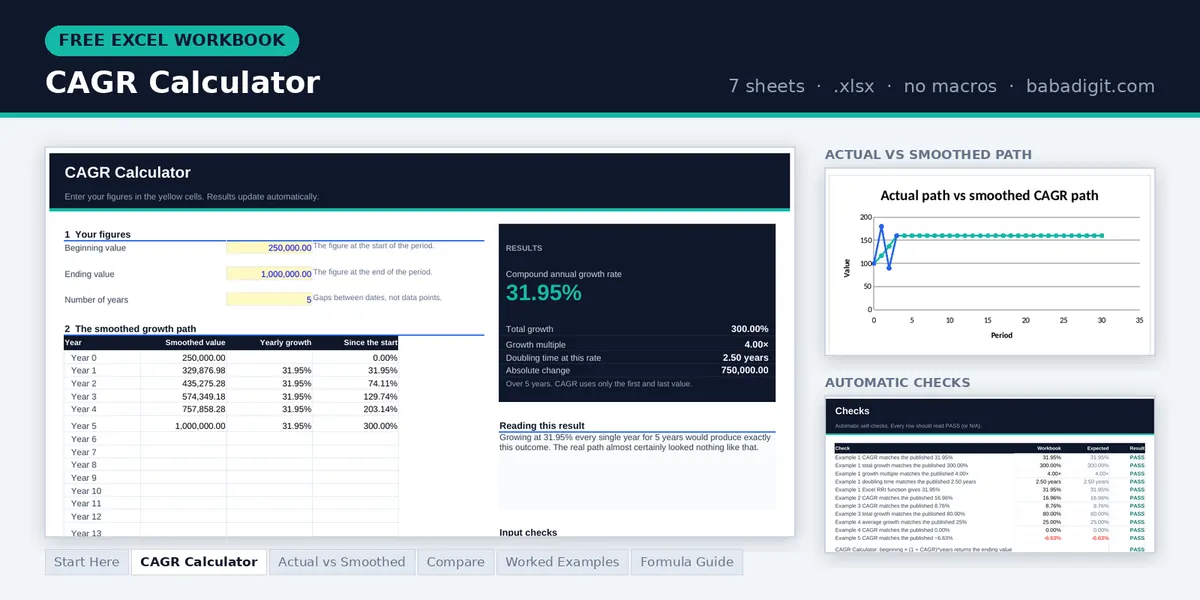
- CAGR Calculator — beginning value, ending value and years; CAGR, total growth, growth multiple, doubling time
- Actual vs Smoothed — your real yearly figures against the smooth CAGR path, with a chart
- Compare — up to four series side by side, ranked by CAGR
- Worked examples, formula guide and checks — including Excel’s RRI() function
Opens in Microsoft Excel or LibreOffice Calc. General information only, not financial advice.
CAGR describes growth that already happened. To project it forward into a full plan, the Financial Model Template is a paid spreadsheet that builds a linked five-year P&L, balance sheet and cash flow from one assumptions sheet. To turn a growth rate into a month-by-month plan, the Sales Forecast Template builds a twelve-month forecast from your own sales history. Browse all templates
What CAGR actually measures
Compound annual growth rate is the single steady rate that would have carried a number from where it started to where it ended, if it had grown by exactly that much every year without variation. It is a smoothed, imaginary path fitted to two real points.
That is precisely what makes it useful. Real revenue jumps, stalls and falls back. Comparing two businesses year by year is a mess of noise. CAGR reduces each to one number that can be lined up fairly, and because it compounds, it handles long periods correctly where simple averages do not.
It is also precisely what makes it dangerous. CAGR knows only two numbers: the first and the last. Everything that happened in between — the crash, the recovery, the year everything nearly went under — is invisible. A steady grower and a wild ride can produce the identical CAGR, and the ratio will never tell you which you are looking at.
The CAGR formula
CAGR (%) = [(Ending value ÷ Beginning value) ^ (1 ÷ years) − 1] × 100Total growth (%) = (Ending value ÷ Beginning value − 1) × 100Count years as the gaps between dates, not the number of figures you have. Revenue for 2021, 2022, 2023 and 2024 is four data points but three years of growth. Using four is the most common error in CAGR calculations and it understates the rate every time.
This is the same arithmetic as the annualised figure on the ROI calculator. The difference is only in what you feed it: ROI compares money returned against money invested, while CAGR compares any value against its earlier self.
Three worked examples
Revenue growth
A business over five years
Revenue was $250,000 five years ago and is $1,000,000 today.
CAGR = (4.00 ^ (1 ÷ 5) − 1) × 100 = 31.95%
Total growth = 300.00% over the whole period
Note how different those two numbers feel. “We grew 300%” and “we grew 32% a year” describe the same business. The first sounds better in a pitch; the second is the one an investor will actually use.
What it hides
A very bumpy three years
A company starts at 100. Year one it rockets to 180. Year two it collapses to 90. Year three it recovers to 160.
A calm-sounding 17% a year, describing a business that nearly halved in the middle. Anyone reading only the CAGR would have no idea. Always show the underlying series alongside it — and be suspicious when someone quotes a CAGR without one.
Investment
A holding over seven years
An investment of $10,000 is worth $18,000 seven years later.
Total growth = 80.00%
Eighty percent sounds impressive until it is spread across seven years. At 8.76% a year the honest comparison is against what an index fund or a savings product would have paid over the same stretch — which is the entire point of annualising.
CAGR versus average annual growth
These are not the same thing, and confusing them produces badly wrong answers. Take a value that doubles in year one, then halves in year two, ending exactly where it began:
Year 2: 200 → 100 (−50%)
Average annual growth = (100 + (−50)) ÷ 2 = +25% a year
CAGR = ((100 ÷ 100) ^ (1 ÷ 2) − 1) × 100 = 0.00%
The arithmetic average claims 25% annual growth for a business that ended exactly where it started. CAGR reports zero, which is the truth. Whenever percentages are chained together over time, the simple average is the wrong tool.
Where CAGR misleads you
CAGR, IRR and average growth compared
| Measure | What it uses | Handles cash in and out? | Best for |
|---|---|---|---|
| CAGR | First and last value only | No | Revenue, users, any single series |
| IRR | Every cash flow and its date | Yes | Investments with contributions |
| Average growth | Each year’s percentage, averaged | No | Almost nothing — it overstates |
How to calculate CAGR in Excel or Google Sheets
Beginning value in B1, ending value in B2, years in B3:
=(B2/B1)^(1/B3)-1=RRI(B3,B1,B2) ← built-in equivalentFormat the cell as Percentage rather than multiplying by 100. RRI does exactly the same job and is easier for someone else to read later.
Frequently asked questions
How many years should I enter?
Count the gaps between your first and last dates, not how many figures you have. Data for 2020 through 2025 is six data points but five years of growth. Entering six would understate the rate. If your period is not whole years, use the fraction — 18 months is 1.5.
Can CAGR be negative?
Yes. If the ending value is lower than the beginning value, the CAGR is negative and represents a steady annual rate of decline. A fall from $500,000 to $380,000 over four years is a CAGR of about −6.63% a year.
Why can I not use zero as the starting value?
The formula divides the ending value by the beginning value, and division by zero has no answer. There is no mathematical fix. When a figure starts at zero or below, quote the absolute change instead and describe the period in words.
CAGR or IRR?
CAGR when money goes in once and you are measuring a single value over time. IRR when cash moves in and out along the way, because IRR accounts for the timing and size of every flow. Using CAGR on an investment you kept adding to will give a wrong and usually flattering answer.
Does CAGR account for inflation?
Not unless you make it. It reports nominal growth using the figures you feed it. To get a real growth rate, either deflate both the beginning and ending values into the same year’s money first, or subtract the inflation rate over the period from the result as a rough approximation.
Is a high CAGR always good?
No. A very high CAGR over a short period usually reflects a small starting base rather than a strong business — going from 2 customers to 20 is 900% growth and means little. Check the absolute numbers underneath, the length of the period, and whether the starting point was unusually low.
How do I calculate CAGR when the starting value is negative?
You cannot get a meaningful CAGR from a negative or zero starting value — in Excel the formula returns #NUM! or a figure that means nothing. Use one of these instead: quote the absolute change and the average change per year (a $50,000 loss turning into a $200,000 profit over three years is a $250,000 improvement, about $83,333 a year); measure growth from the first year the figure was positive; or calculate CAGR on a related figure that stays positive, such as revenue. If both values are negative the formula can return a number, but it describes how the size of the loss changed, not growth.
References
- Brealey, R. A., Myers, S. C. & Allen, F. Principles of Corporate Finance, 13th edition, McGraw-Hill Education — on compounding and rates of return over time.
- Damodaran, A. Investment Valuation: Tools and Techniques for Determining the Value of Any Asset, 3rd edition, Wiley — on growth rate estimation and its pitfalls.
Keep going
Written and reviewed by Ghayas Uddin, MS (Finance), financial analyst. Last reviewed 21 September 2026. Found an error? Email support@babadigit.com and we will correct it.