

Anyone can calculate a current ratio. The difficulty is knowing which ratios matter, how they relate to each other, and which direction is good. This template answers all three.
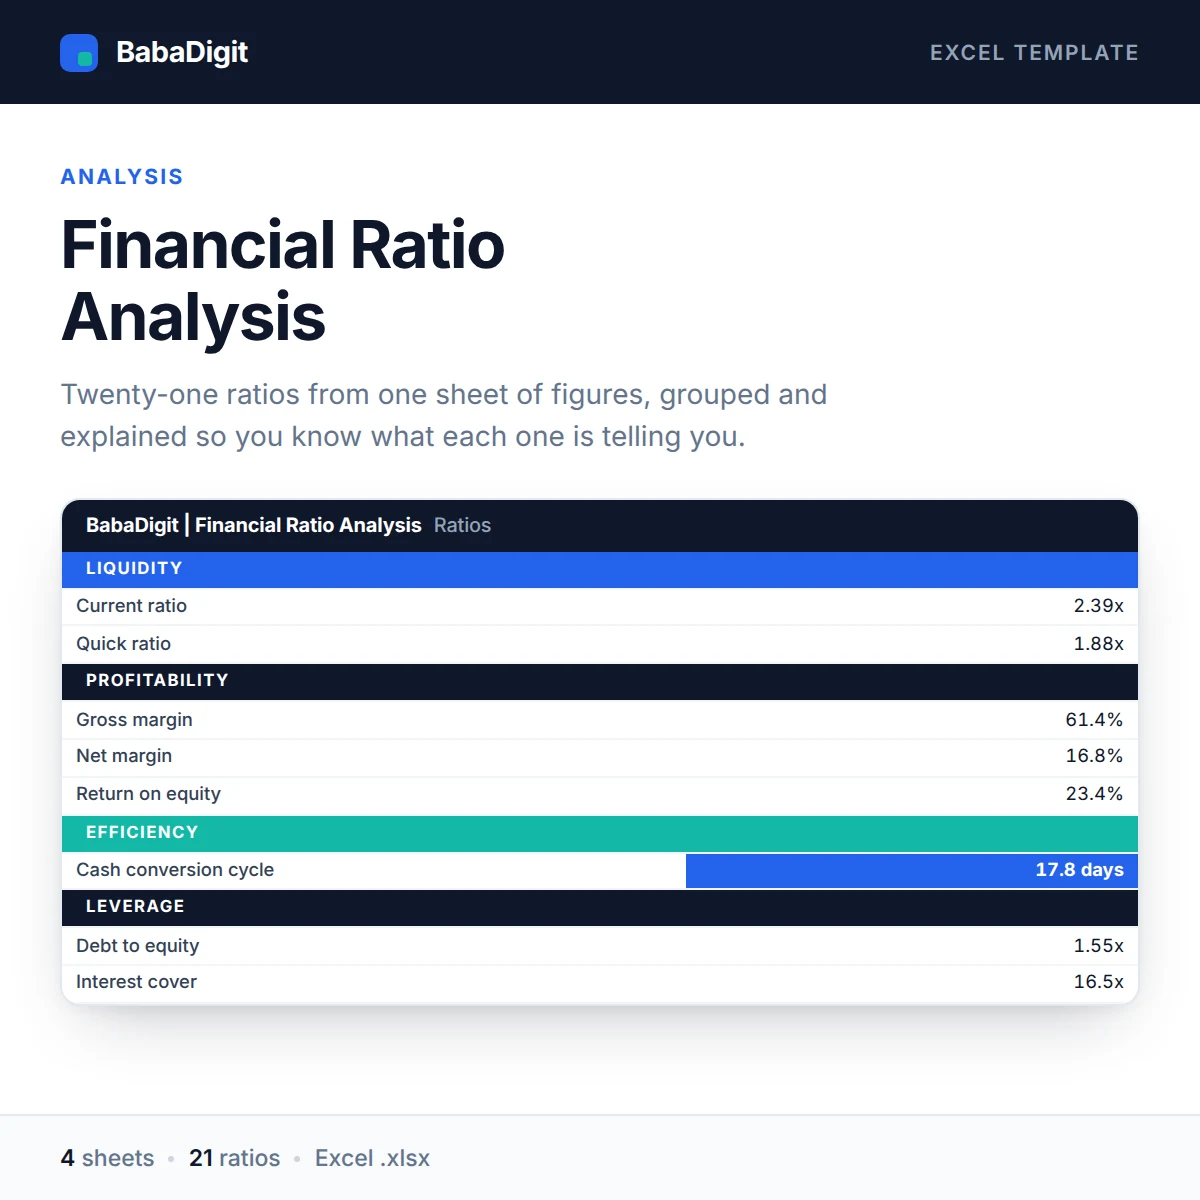
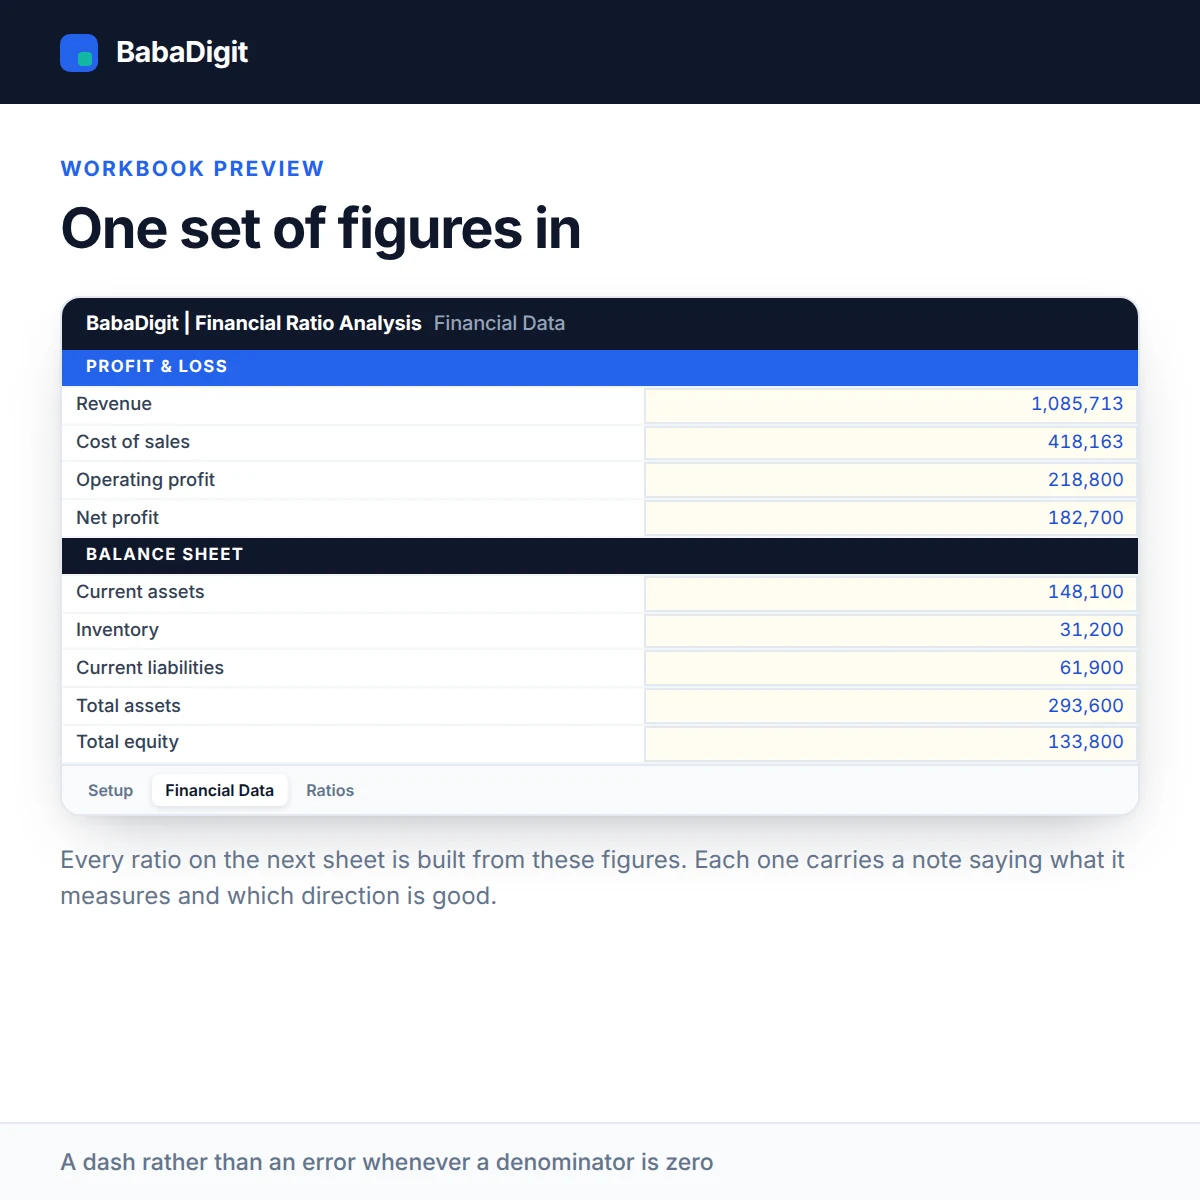
You enter a single set of P&L and balance sheet figures. Twenty-one ratios come out, grouped into liquidity, profitability, efficiency and leverage, each with a short note saying what it measures and whether higher or lower is the better direction.
The efficiency group includes the cash conversion cycle, which is where most small-business cash problems actually live — money tied up in stock and unpaid invoices while suppliers want paying.
It takes its figures in the same shape as the BabaDigit P&L and Balance Sheet templates, so the three work together.
What you get
- Liquidity: current, quick, cash and working capital ratios
- Profitability: gross, operating and net margin, return on assets and equity
- Efficiency: asset turnover, inventory, receivable and payable days, cash cycle
- Leverage: debt to equity, gearing, interest cover, debt to assets
- A plain-English note on every ratio
- Configurable currency — no currency is hard-coded
- No country’s tax rates or statutory rules built in
- Sheets protected without a password
- No macros, no add-ins, no internet connection required
Who it is for
Owners, managers, lenders and advisers who want to read a set of accounts properly rather than glance at the bottom line.
In the download
- Excel workbook, fully formula-driven
- README with the full usage guide
- Licence covering commercial and client use
- Worked sample data throughout, clearly labelled
Sheets in the workbook
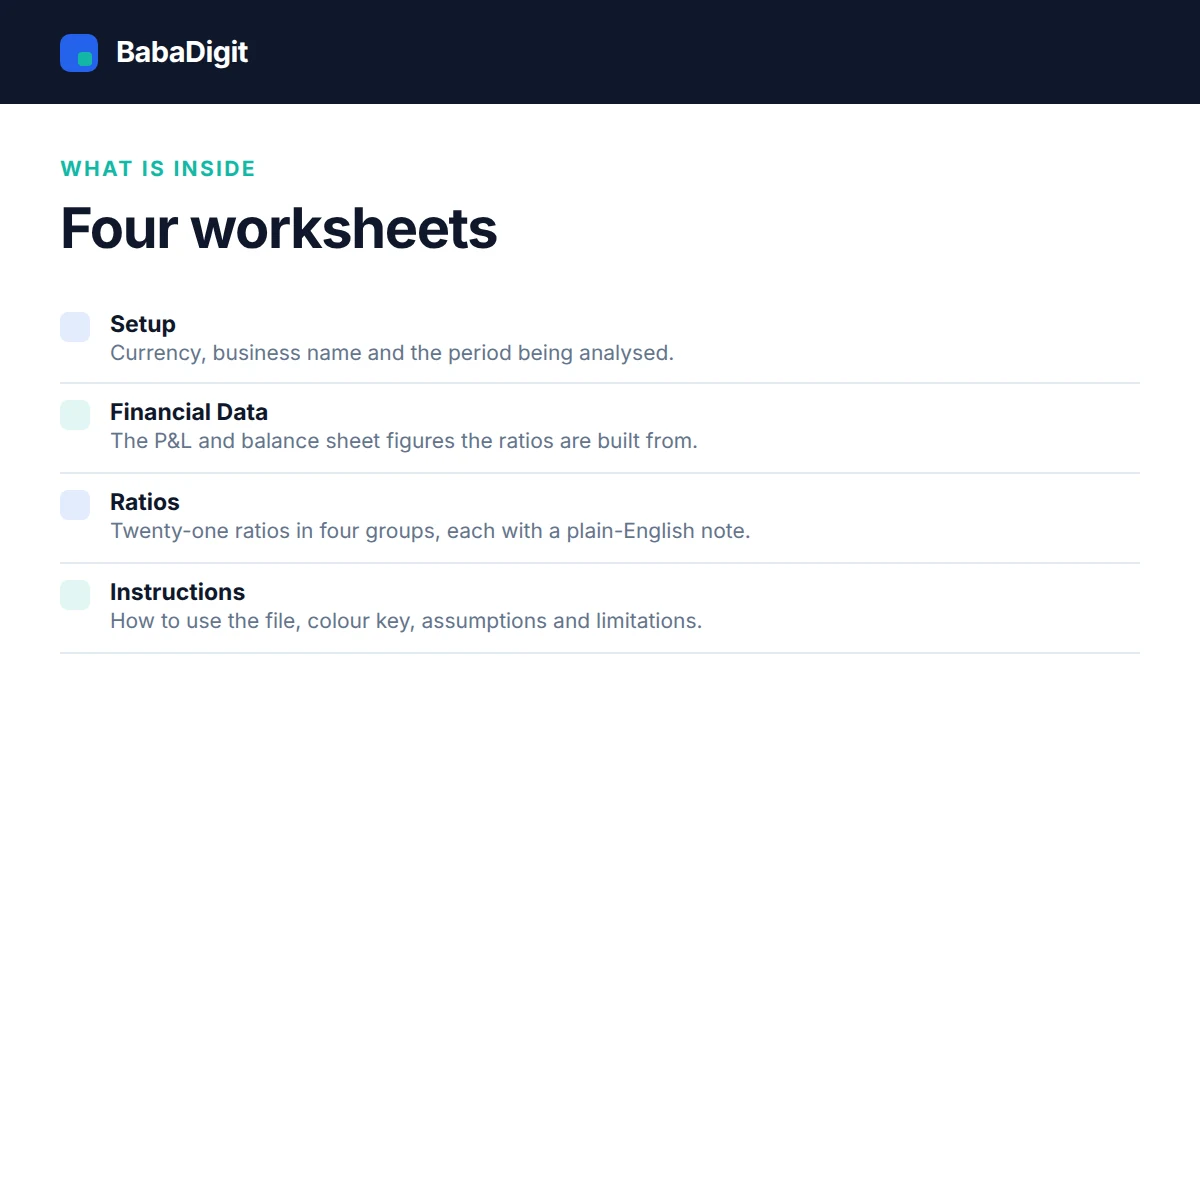
- Instructions — How to use the file, colour key, assumptions and limitations.
- Setup — Currency, business name and the period being analysed.
- Financial Data — The P&L and balance sheet figures the ratios are built from.
- Ratios — Twenty-one ratios in four groups, each with a plain-English note.
Requirements
- Microsoft Excel 2016 or later, or Microsoft 365
- Also opens in LibreOffice Calc, Google Sheets (import) and Apple Numbers
- No macros, no add-ins, no internet connection required
Please read
- Ratios describe a position, they do not explain it. Two businesses with the same current ratio can be in completely different health.
- Industry benchmarks vary enormously and none are built in — comparing against a generic benchmark is usually misleading.
- General information only, not financial, investment or accounting advice.
- Sample data is included and clearly labelled. It is illustrative only.
- This is a tool, not financial, accounting, tax or legal advice.
Reviews
There are no reviews yet.